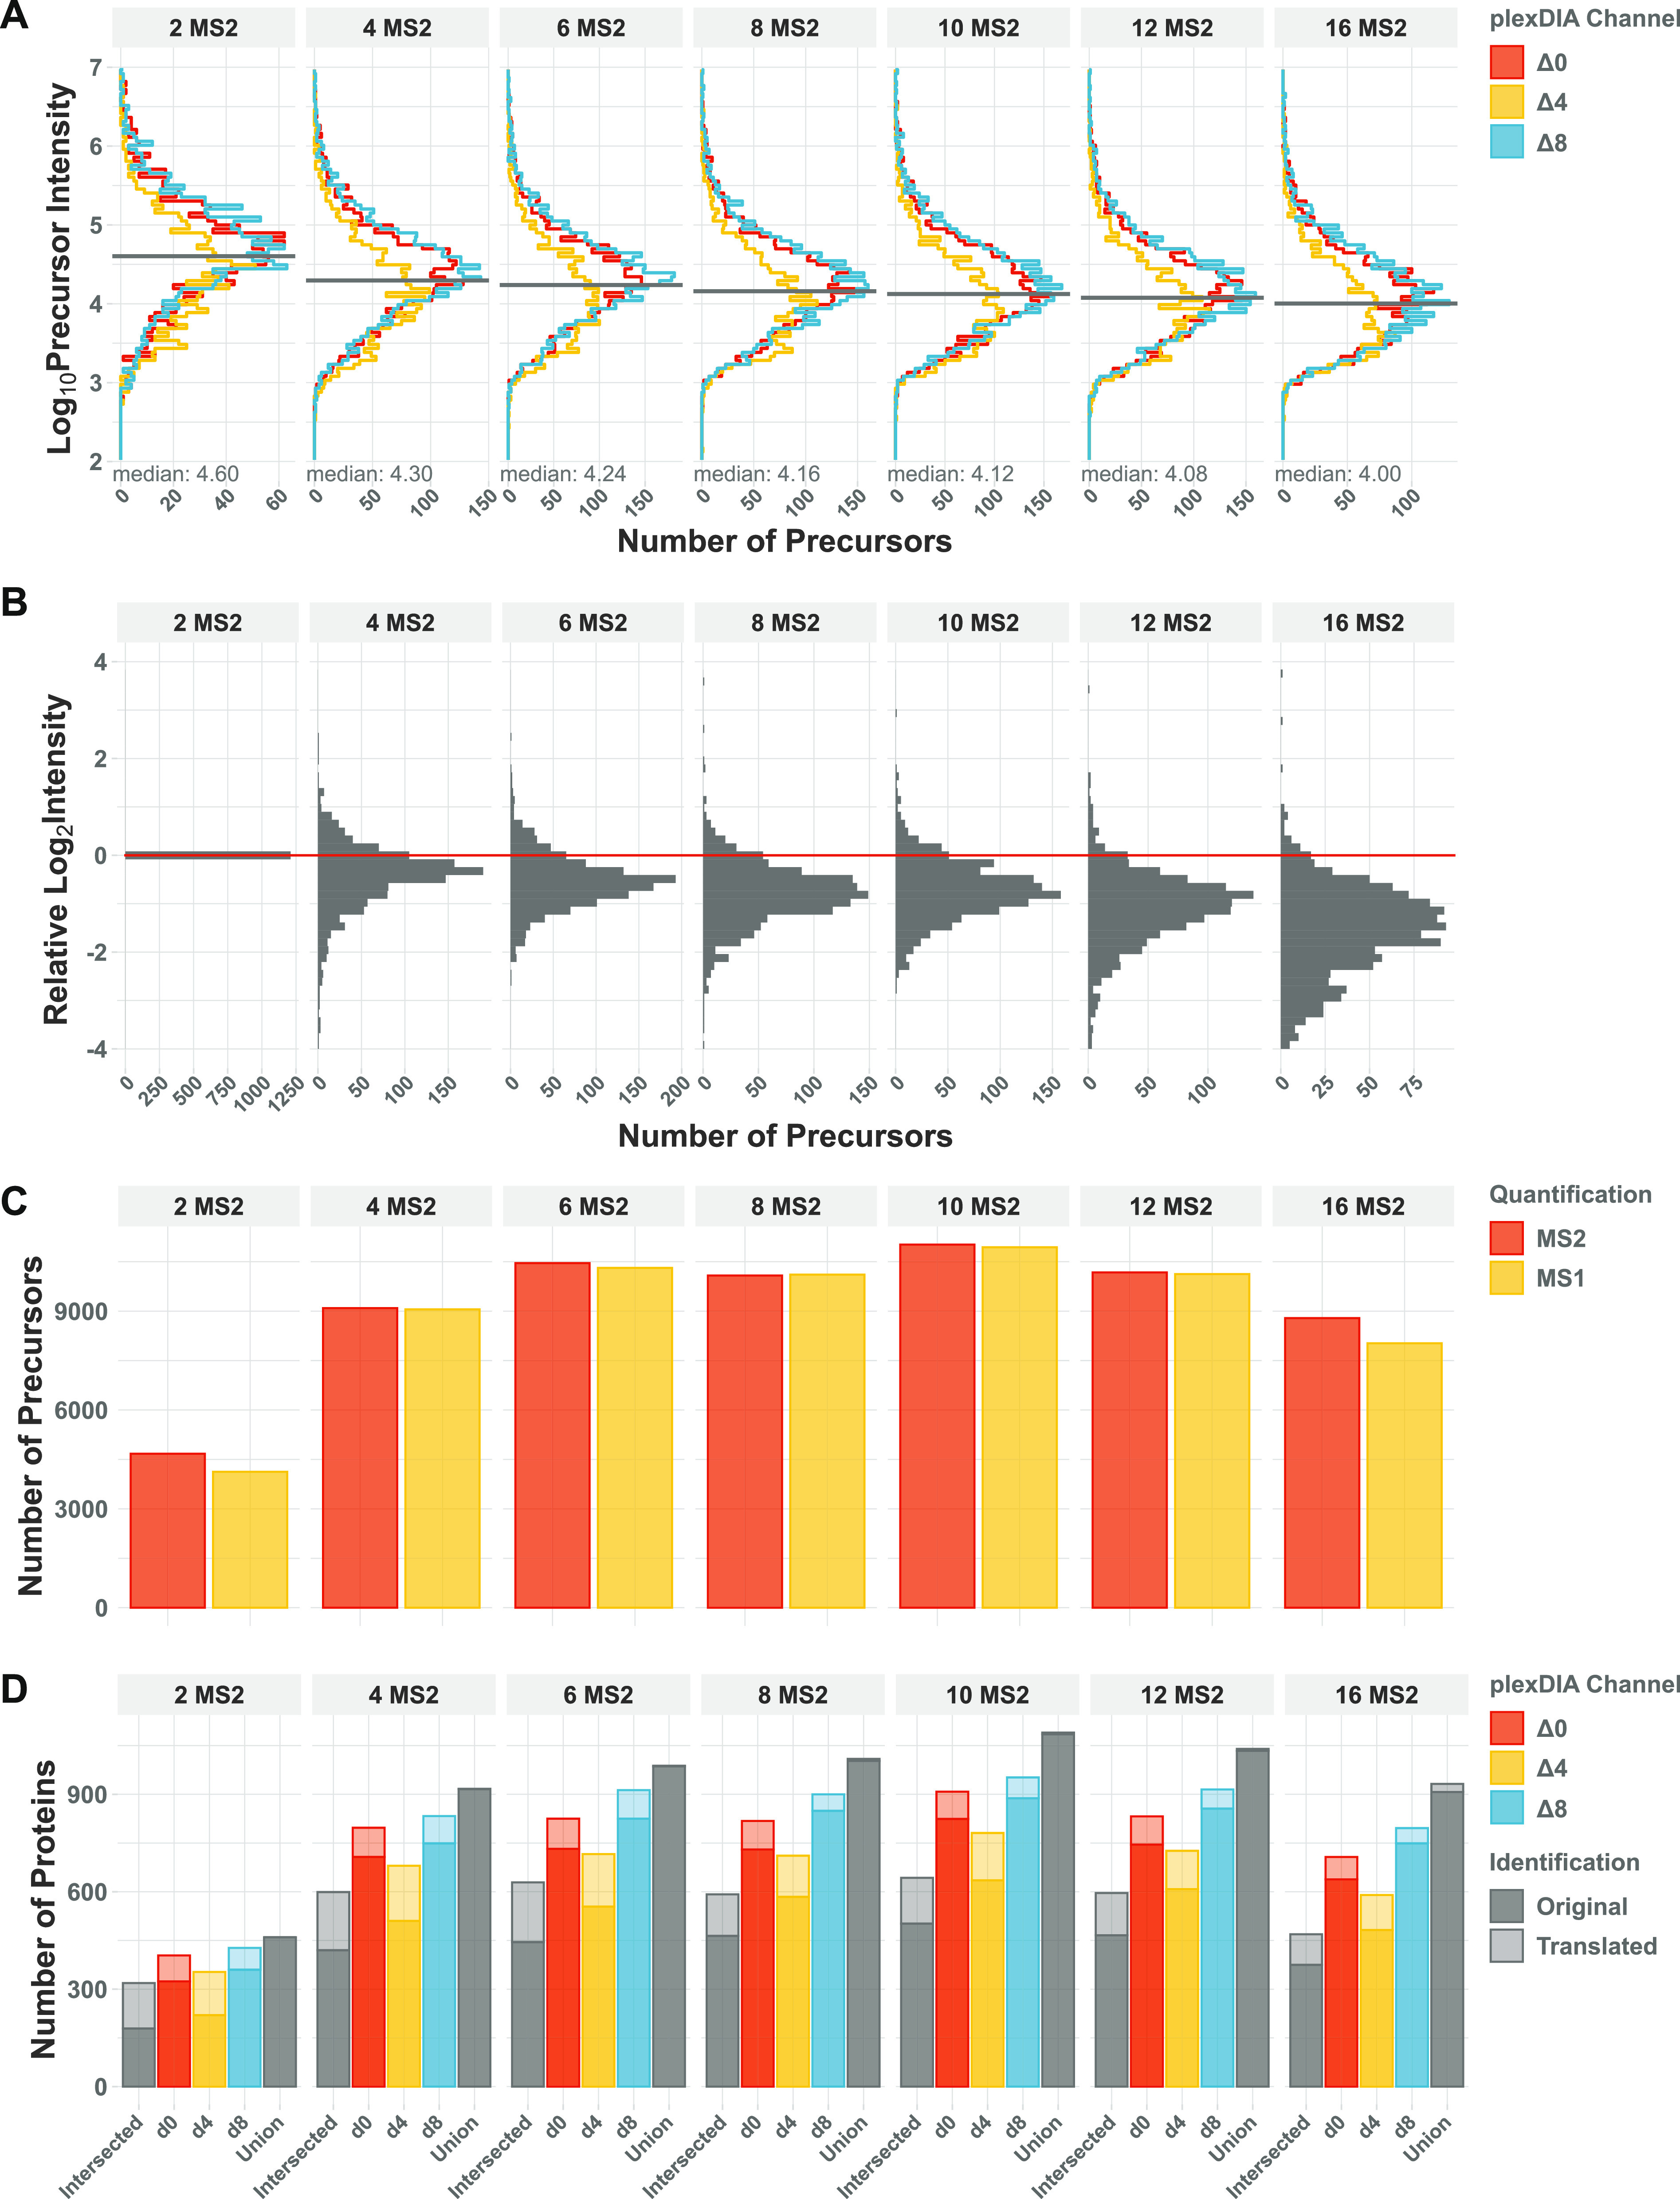
Figure 2.

Optimizing the number of MS2 windows in the duty cycle of plexDIA methods. Example DO-MS output for a plexDIA experiment using 3-plex bulk lysate diluted down to the single-cell level with different numbers of MS2 windows. All intensities were extracted as peak heights. (A) Histogram of precursor (MS1) intensities for each plexDIA channel shown separately. (B) Distributions of ratios between precursor intensities for precursors identified across all conditions. All ratios are displayed on the log2 scale relative to the first condition. (C) The total number of identified precursors per run is shown. Numbers are shown for precursors with MS1 (yellow) and MS2 (red) level quantification. (D) The number of protein identifications in a plexDIA set is shown for each non-isobarically labeled sample (channel). Proteins shared across all three sets and the entirety of all proteins across sets is shown in gray. Identifications which were propagated within the set are highlighted with lighter colors.
