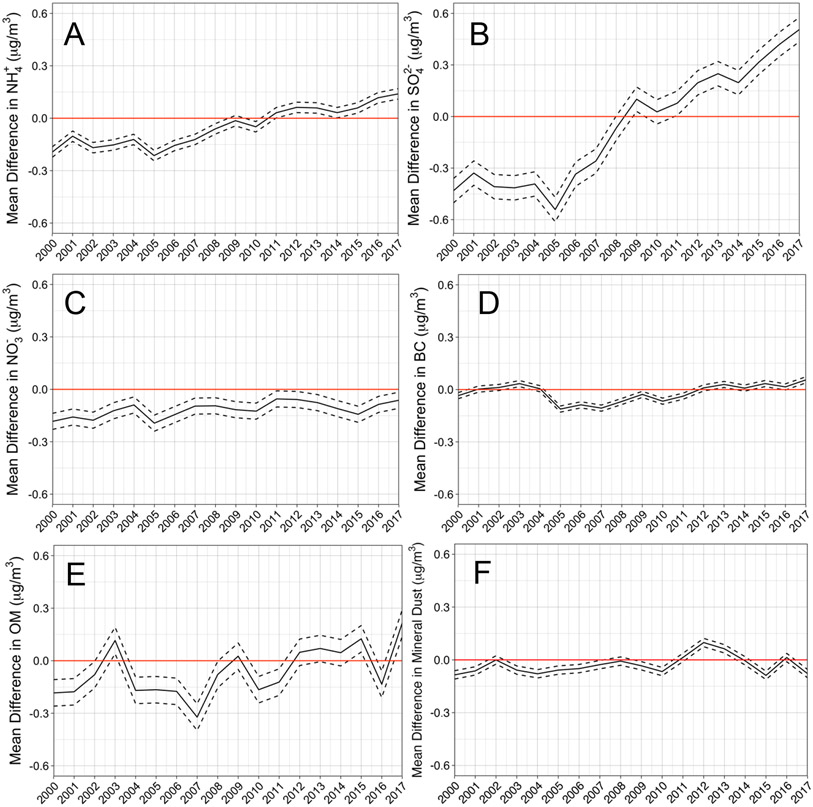
Figure 2: Mean difference in annual PM2.5 component concentrations between AI- and non-AI-populated counties: 2000–2017.
The solid line represents the total estimated effect (adjusted for calendar year, random intercepts for counties within states, population density and income deciles, and county type × year interaction) of being classified as an AI-populated county vs. non-AI-populated county on annual concentrations of each PM2.5 component over the study period; the dashed lines show the 95% confidence intervals from the primary analysis. The solid red line represents no difference on average in adjusted component concentrations between AI and non-AI-populated counties.

