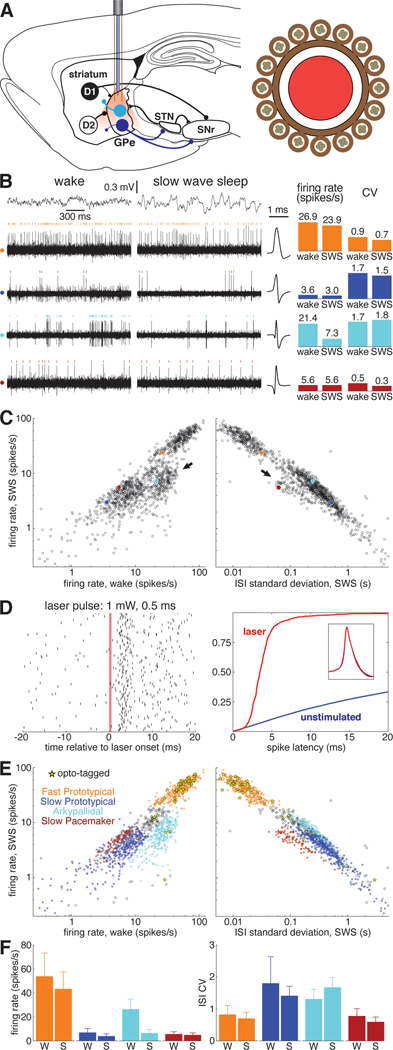
Figure 1. Identification of GPe subpopulations in unrestrained rats.
(A) Left, Simplified schematic of the basal ganglia. Striatal projection neurons with D1 dopamine receptors form the direct pathway to the SNr, while D2-expressing neurons form the indirect pathway via GPe. Prototypical GPe neurons (dark blue) project heavily to the STN and SNr. Arkypallidal cells (light blue) project exclusively to the striatum. Right, cross section of the combined probe for recording neurons and light delivery for optogenetic tagging, consisting of 16 tetrodes surrounding an optic fiber (see Methods). Abbreviations: GPe, globus pallidus pars externa; STN, subthalamic nucleus; SNr, substantia nigra pars reticulata.
(B) Left, example of simultaneously recorded signals during wakefulness and sleep. Top traces show electrocorticogram (ECoG) activity used to identify behavioral state, lower rows show spiking on each of 4 wires, each from a different tetrode. For each wire spikes from one isolated single-unit are marked with colored ticks. Corresponding average spike waveforms for each of these example units are plotted immediately to the right of the traces. Right, bar graphs show the average firing rate and ISI CV of each example unit during wakefulness and SWS.
(C) Average firing rate of GPe units during SWS as a function of wake firing rate (left) and ISI standard deviation during SWS (right) on a logarithmic scale. Each of the 4 example cells are plotted as filled circles with the color corresponding to the raster ticks and bars of B. Arrows mark two GPe populations that deviate from the prototypical relationship between SWS rate, wake rate, and SWS ISI SD that describes the activity of the majority of GPe neurons. See also Figures S1, S6.
(D) Left, raster plot of an optotagged GPe unit in response to a 0.5-ms laser pulse. The red bar marks the time when the laser is active. Right, cumulative distribution of latency to first spike following laser activation in this unit (red). Optotagging is assessed in part by comparing this latency distribution to that following randomly-chosen times (blue). Inset, spike waveform for this unit before laser activation (blue) and in the 10 ms following laser activation (red).
(E) Top, same as B, save that fill color denotes cell type and yellow stars denote optotagged cells.
(F) Bar graphs indicating the average firing rate and ISI CV for each cell type during wakefulness and SWS. Error bars show standard deviation.

