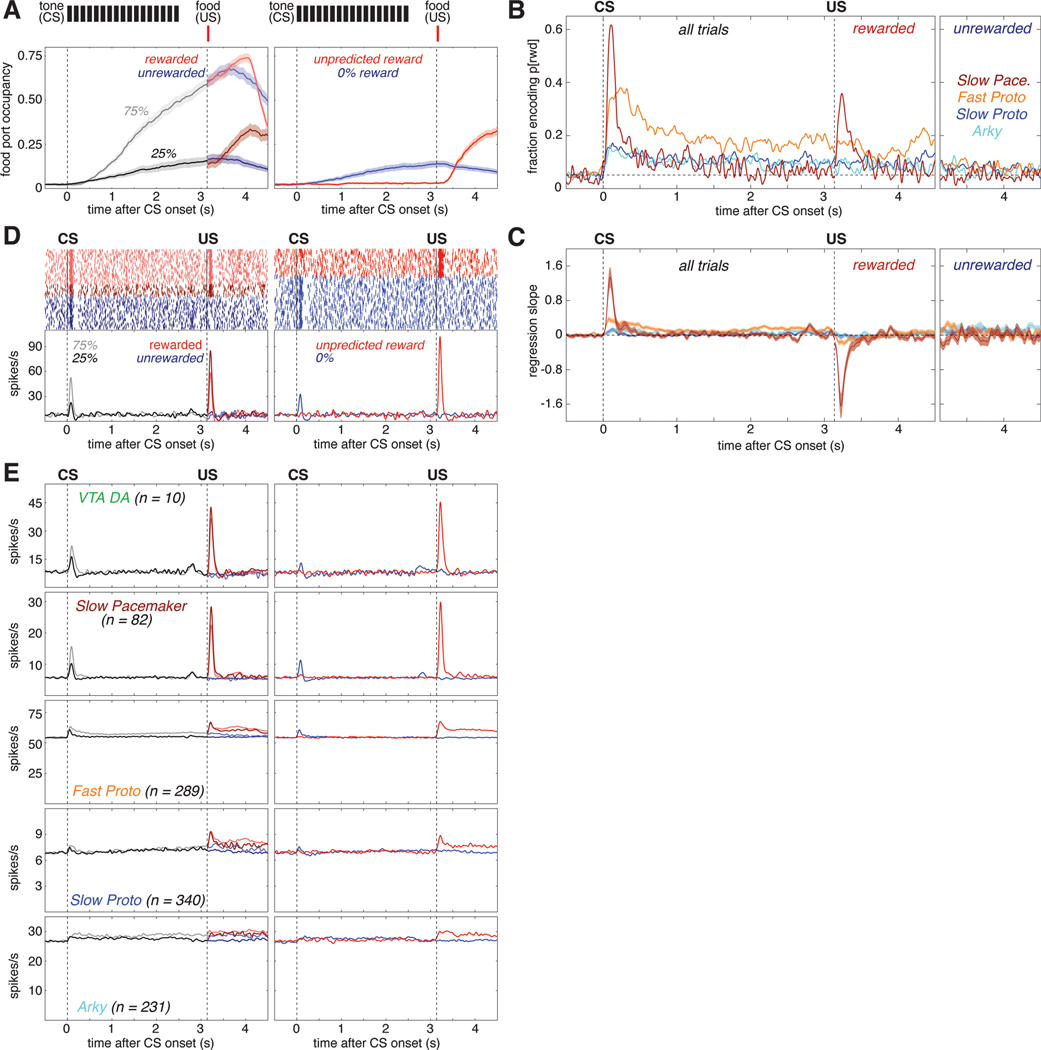
Figure 2. Subpopulation-specific value and RPE coding in the Pavlovian task.
(A) Fraction of trials the rat’s snout is in the food port (food port occupancy) as a function of time in trial, averaged over 66 recording sessions in 5 rats. Shaded areas indicate the standard error (SE). Top, the timing and duration of each tone pip of the CS is denoted by black bars; red bars show the timing of reward delivery (if any). Left, food port occupancy on trials with 25% reward (dark gray) or 75% reward (light gray) CS. After reward delivery or omission, trials are broken into rewarded (light/dark red) and unrewarded (light/dark blue) cases and averaged separately. Right, food port occupancy on trials with the 0% reward CS (blue) and trials where reward was delivered without CS (red). Vertical dashed lines mark the time of CS onset and reward delivery.
(B) Fraction of cells whose value (prob[reward]) regression slope was significantly (p<0.05) different from zero as a function of time in trial for each GPe cell type. All trials are included in the regression model before US; after the US, rewarded (left) and unrewarded trials (right) are analyzed separately. There was little or no consistent encoding of reward omission by GPe subpopulations. Horizontal dashed line marks the 5% fraction expected by chance. To significantly exceed this chance level (binomial test, p < 0.05), the fraction required depends on the number of cells in the subpopulation, as follows: Fast Protos (n = 289), 7.0%; Slow Protos (n = 340), 6.9%; Arkys (n = 231), 7.3%; Slow Pacemakers (n = 82), 8.6%. See also Figure S2.
(C) Mean regression slope for value for each GPe cell type; shaded areas show SE.
(D) Example of a Slow Pacemaker cell recorded during Pavlovian conditioning. Top left, spike raster with each row representing one trial. Raster ticks are colored by CS and outcome: rewarded following 75% prob[rwd] cue (light red), rewarded following 25% prob[rwd] cue (dark red), unrewarded following 75% p[rwd] cue (light blue), unrewarded following 25% p[rwd] cue (dark blue). Top right, spike raster for trials where the CS predicted no chance of reward (blue) or reward was delivered without CS (red). Bottom, same data expressed as a firing rate. Before US, all data associated with a given CS are averaged together; after US, rewarded and unrewarded trials are averaged separately. Color scheme same as A. See Figures S5, S6 for examples in other cell types.
(E) Activity during Pavlovian conditioning averaged across all cells of a given type. Top row shows the activity of VTA dopamine cells (from Mohebi et al.10) for comparison to GPe cell types (rows 2–5). Color scheme same as A, D.

