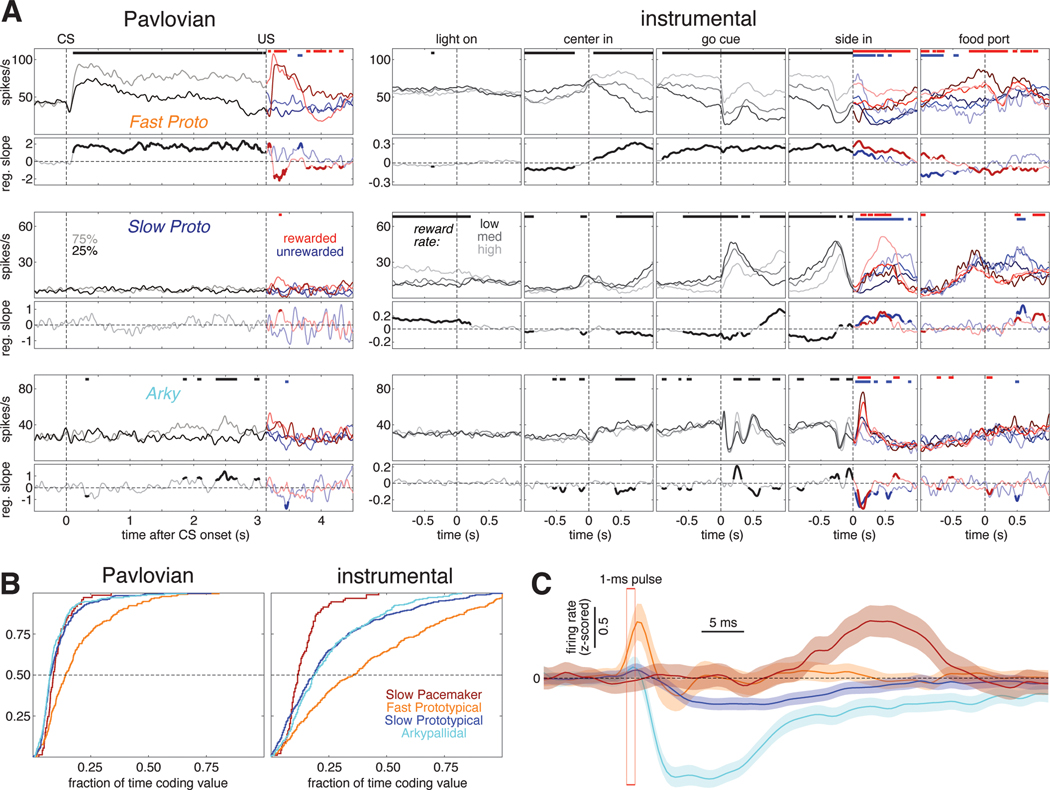
Figure 5. Fast Proto cells show sustained value coding, and can rapidly inhibit Arkys.
(A) Example cells. Each row shows the activity of one GPe cell during both Pavlovian and instrumental tasks. The top panels of each row show average firing rate for each condition; color scheme is the same as Figures 2D and 3D. The bottom panels of each row plot the corresponding regression slope for value. Here, the slope trace is plotted with a thicker and darker line when significantly different from zero. Regions with significant regression slope are also marked at the top of firing rate plots above (thick horizontal bars). See Figure S5 for more examples.
(B) Cumulative distributions of the fraction of time each GPe cell type spends encoding value.
(C) Average response of each GPe cell type to 1-ms laser activation of the excitatory opsin Chrimson expressed in PV+ GPe neurons. Firing rates were z-scored within each cell and then averaged. Shaded regions show SE. The sharp excitatory response among Fast Protos (orange) appears to slightly precede laser pulse onset because of smoothing (Gaussian, 20ms SD).

