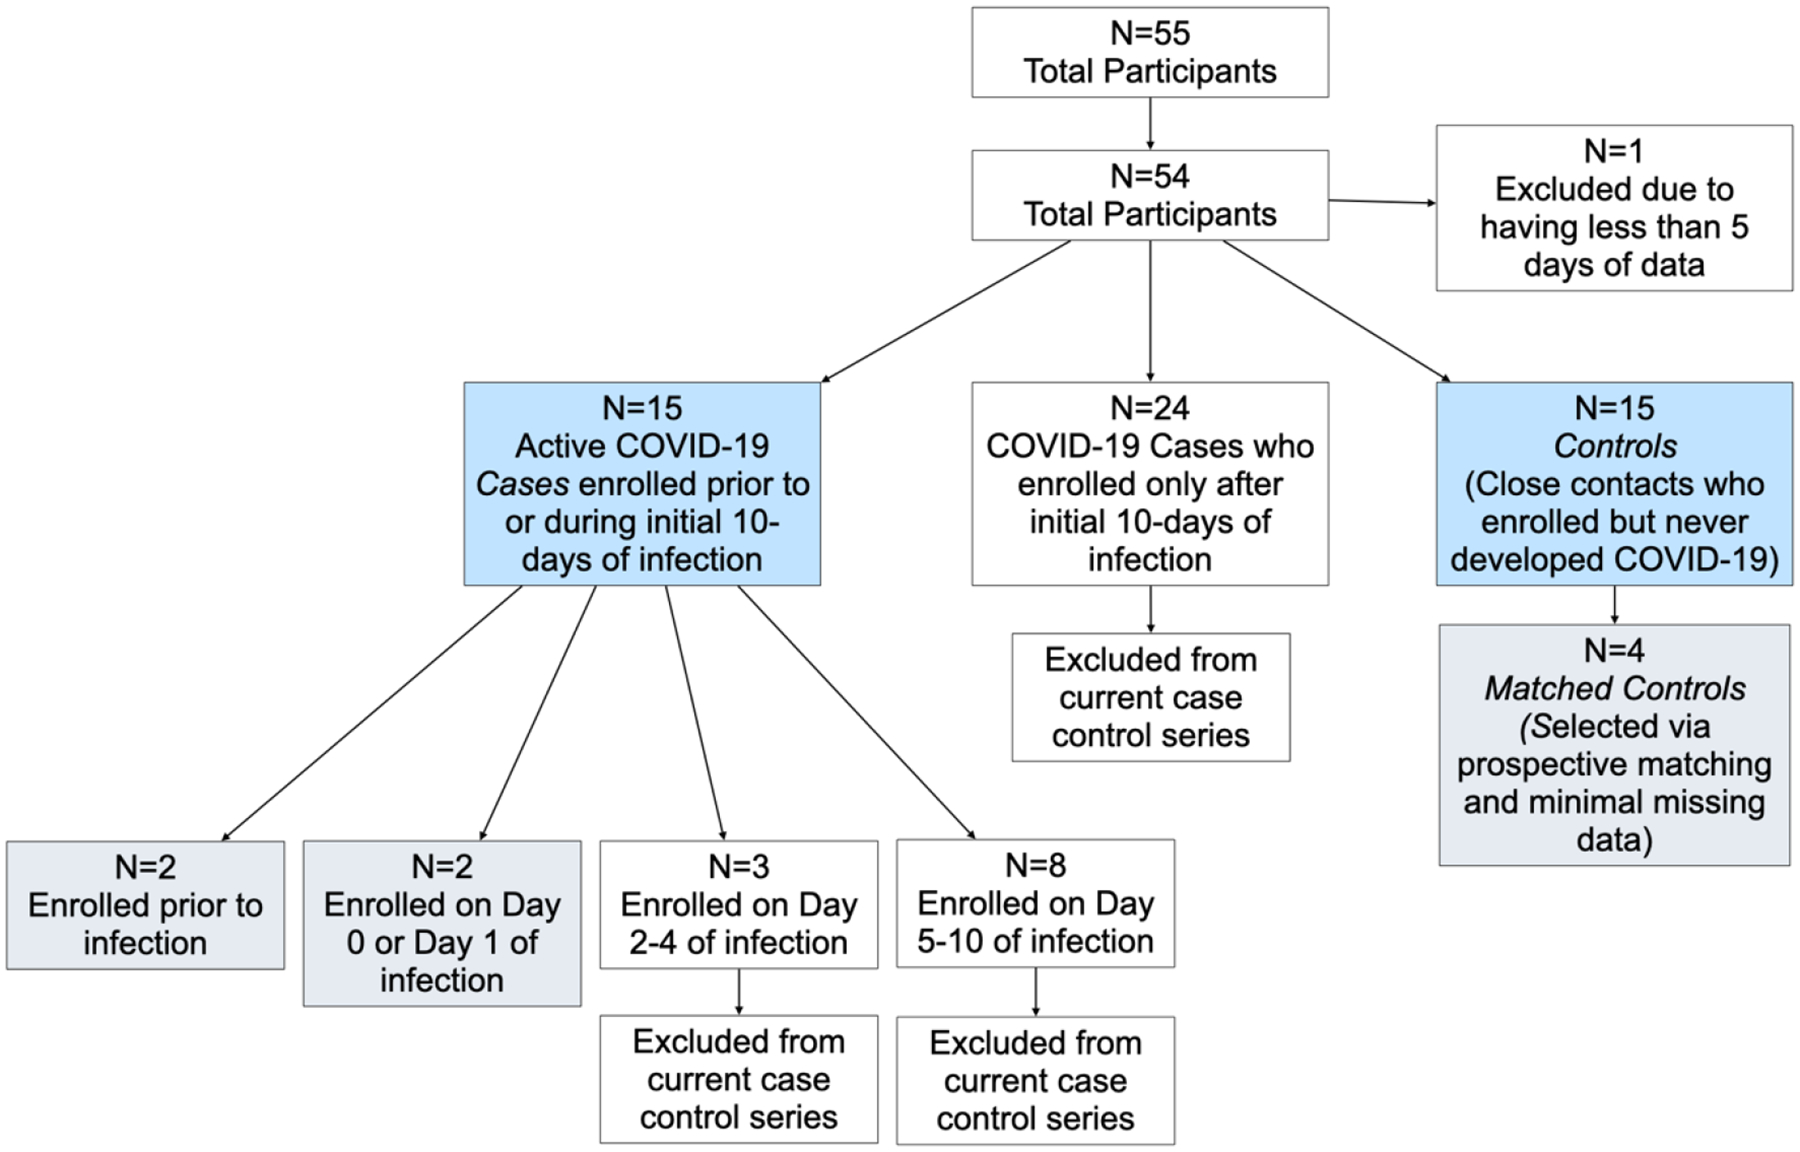
Figure 1:

Flow diagram summarizing selection of cases and controls for this case series. Blue boxes indicate the 30 participants included in the Gaussian Process model regression, and gray boxes indicate the 8 individuals shown in the in-depth panel plots.
