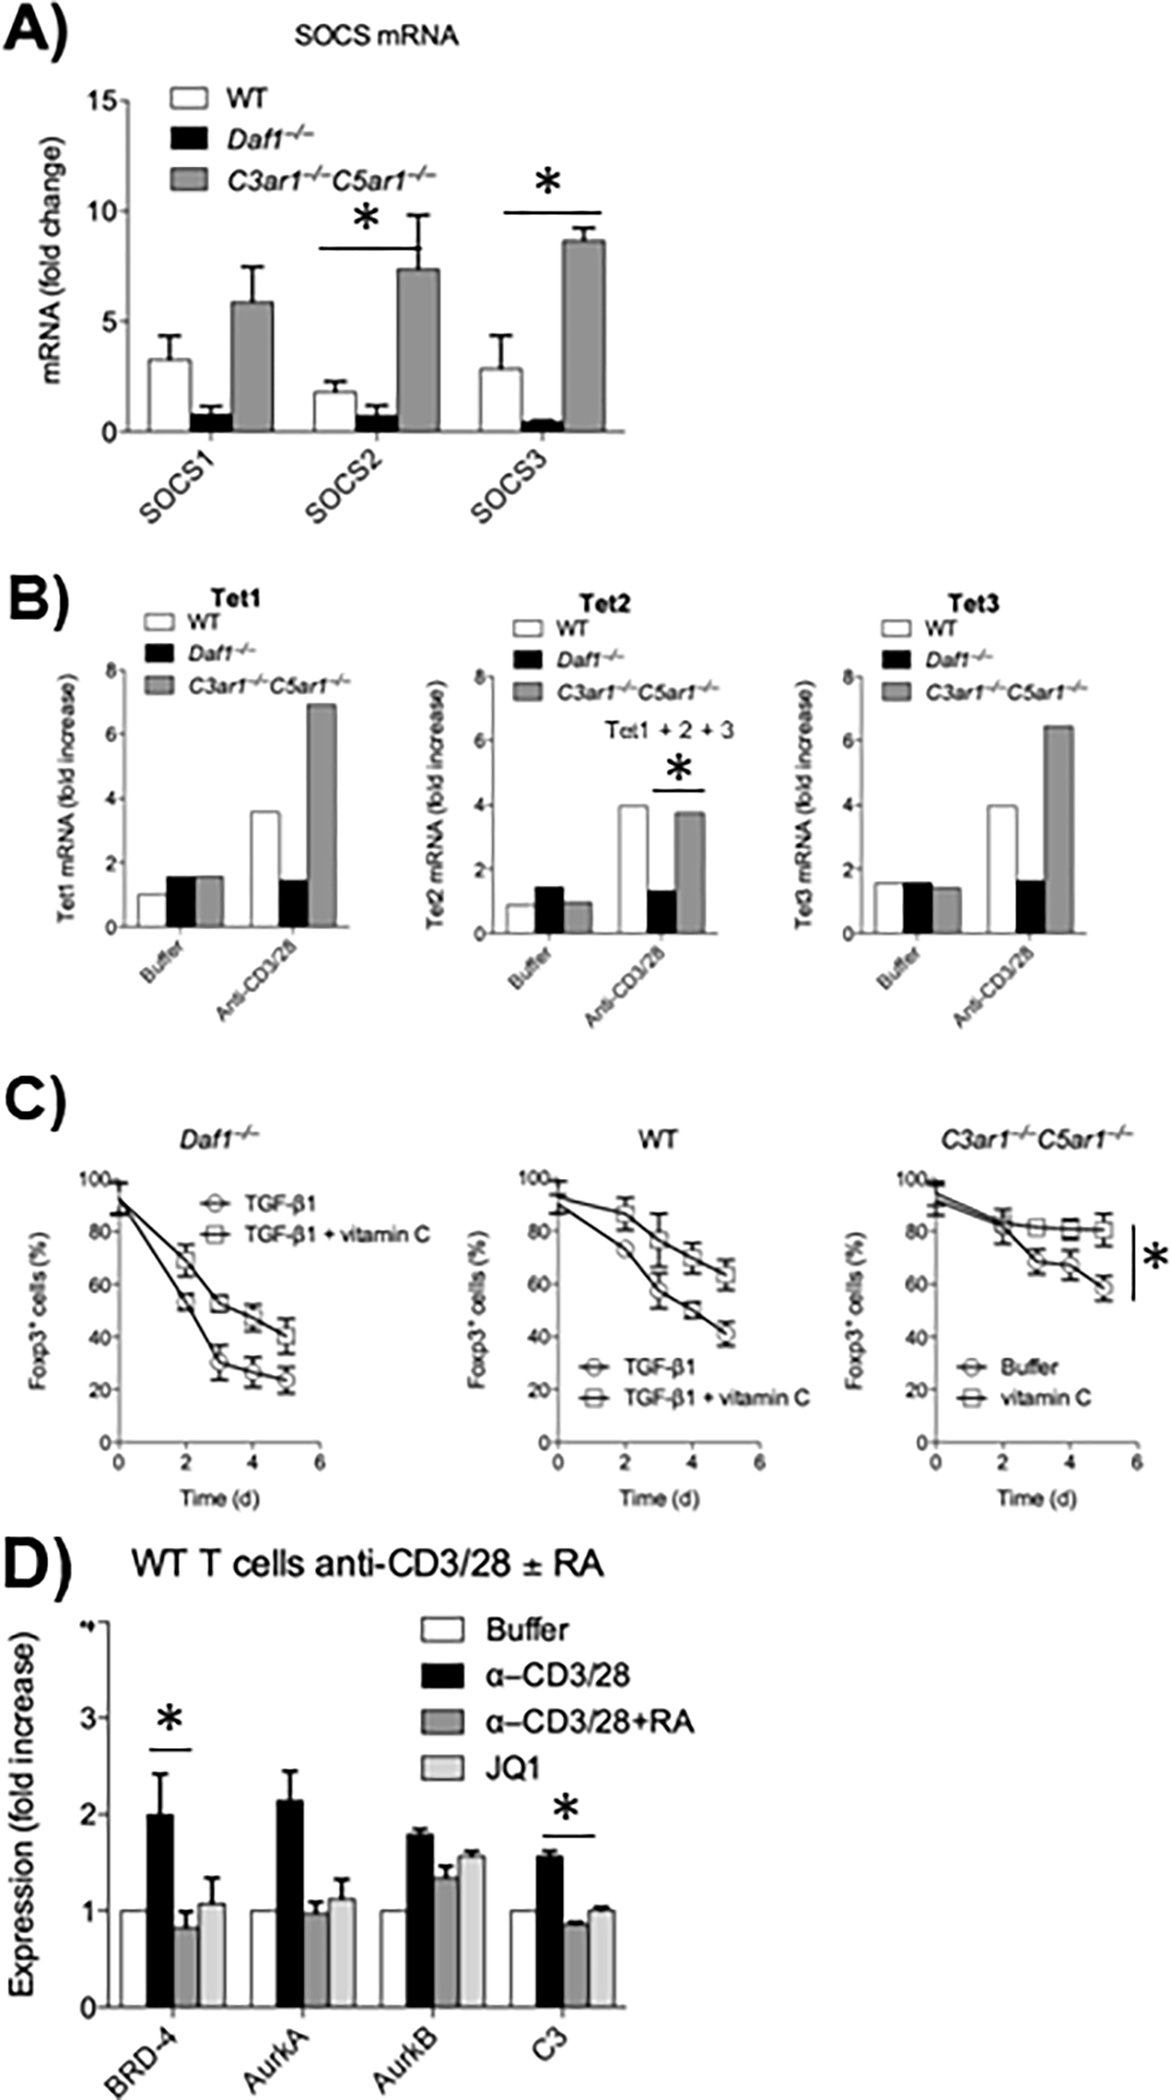
Figure 1: Metabolic pathways connected with absent C3ar1/C5ar1 signaling in activated CD4+ cells.

A) Sorted CD55−/−, WT, and C3ar1−/−C5ar1−/− CD4+ cells were incubated with anti-CD3/28 Dynabeads plus IL-2 for 5 days after which Foxp3+ cells were sorted. A) SOCS1, 3, and 4 mRNA levels. Induction in C3ar1−/−C5ar1−/− vs WT cells and B) TET1, TET2, and TET3 mRNA levels were quantitated by qPCR. Representative of 2 assays. Induction in C3ar1−/−C5ar1−/− vs CD55−/− cells. C) Sorted Foxp3− CD55−/−, WT, and C3ar1−/−C5ar1−/− CD4+ cells were incubated with anti-CD3/28 Dynabeads and IL-2 plus TGF-β in the absence and presence of Vitamin C and percent Foxp3+ cells quantitated daily. Induction in C3ar1−/−C5ar1−/− vs WT− cells. D) WT CD4+ cells were incubated for 1 h with anti-CD3/28 Dynabeads without or with C3ar1/C5ar1 receptor antagonists (RA) or the BRD inhibitor JQ1 after which BRD4, AuraA, AuraB and C3 mRNA levels were assayed by qPCR. Induction in C3ar1−/−C5ar1−/− vs WT− cells. All n=2. * = p<.05.
