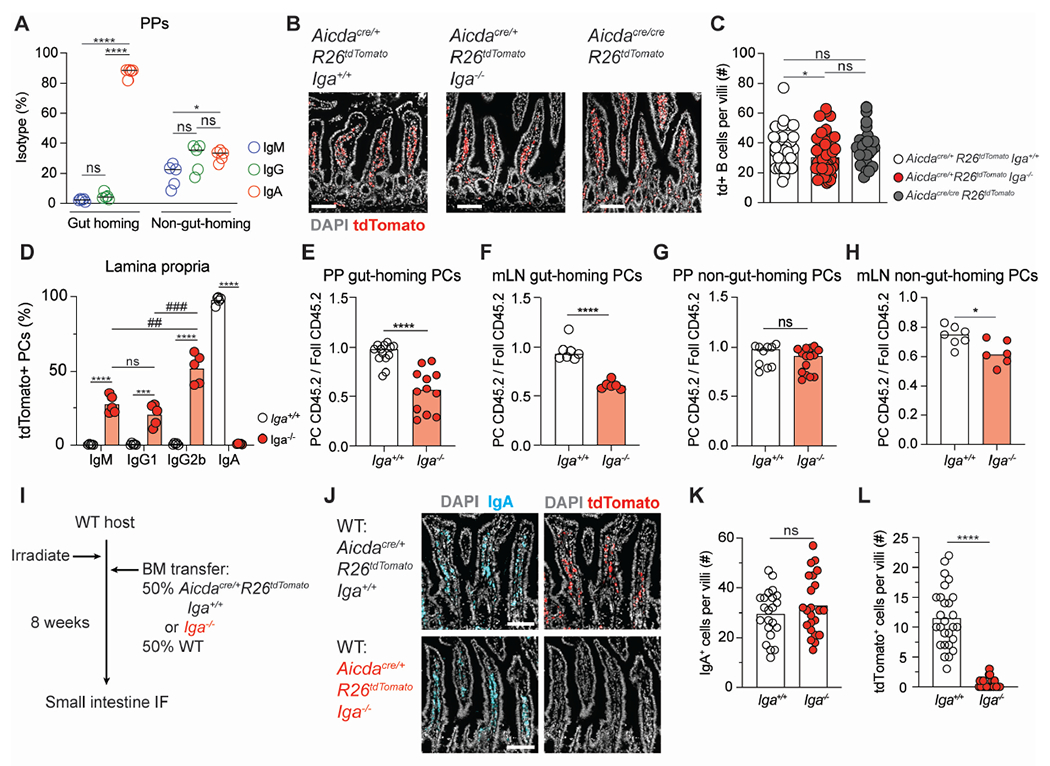
Figure 2. IgA is required for efficient plasma cell homing to the intestinal lamina propria.

(A) Isotypes of gut-homing (α4β7+ CCR9+) and non-gut homing PCs from PPs of WT mice treated with FTY-720 for seven days. IgG is defined as IgG1+ or IgG2b+.
(B) Representative immunofluorescence of small intestinal villi from Aicdacre/+ Rosa26Stop-tdTomato Iga+/+, Aicdacre/+ Rosa26Stop-tdTomato Iga−/−, Aicdacre/cre Rosa26Stop-tdTomato mice stained with DAPI (gray) and tdTomato (red). Scale bars, 100 μm.
(C) Quantification of multiple images as in (B). Number of tdTom+ cells per villi.
(D) Isotype staining in Aicdacre/+ Rosa26Stop-tdTomato Iga+/+ and Aicdacre/+ Rosa26Stop-tdTomato Iga−/− lamina propria. Gated on CD98+ B220− CD4− PCs.
(E, F) Ratio of frequency of CD45.2 gut-homing PCs to CD45.2 Foll B cells from PPs (E) or mLN (F) of mixed BM chimeras.
(G, H) Ratio of frequency of CD45.2 non-gut-homing PCs to CD45.2 Foll B cells from PPs (G) or mLN (H) of mixed BM chimeras.
(I) Aicdacre/+ Rosa26Stop-tdTomato Iga+/+ mixed BM chimera experimental set up for (J-L).
(J) Representative immunofluorescence of small intestinal villi stained for DAPI (gray), IgA (cyan), and tdTomato (red) in WT: Aicdacre Rosa26Stop-tdTomato Iga+/+ or Iga−/− mixed BM chimeras. Scale bars, 100 μm.
(K, L) Quantification of multiple images as in (J). Number of IgA+ cells (K) or tdTom+ cells (L) per villi.
Data from 2 independent experiments with 2-3 mice per group (A, C, D, K, L). Data from at least 3 independent experiments with 3-5 mice per group (E-H). Each symbol represents one mouse. (C, K, L) Each symbol represents one villi with at least 5 villi quantified per image.
ns=not significant, *p < 0.005; ##p < 0.001; ***, ###p < 0.0005; ****p < 0.0001. Unpaired two-tailed Student’s t-test in E-H, K, L. One way ANOVA was used in A(*), C(*), and D(#) .
See also Figure S2.
