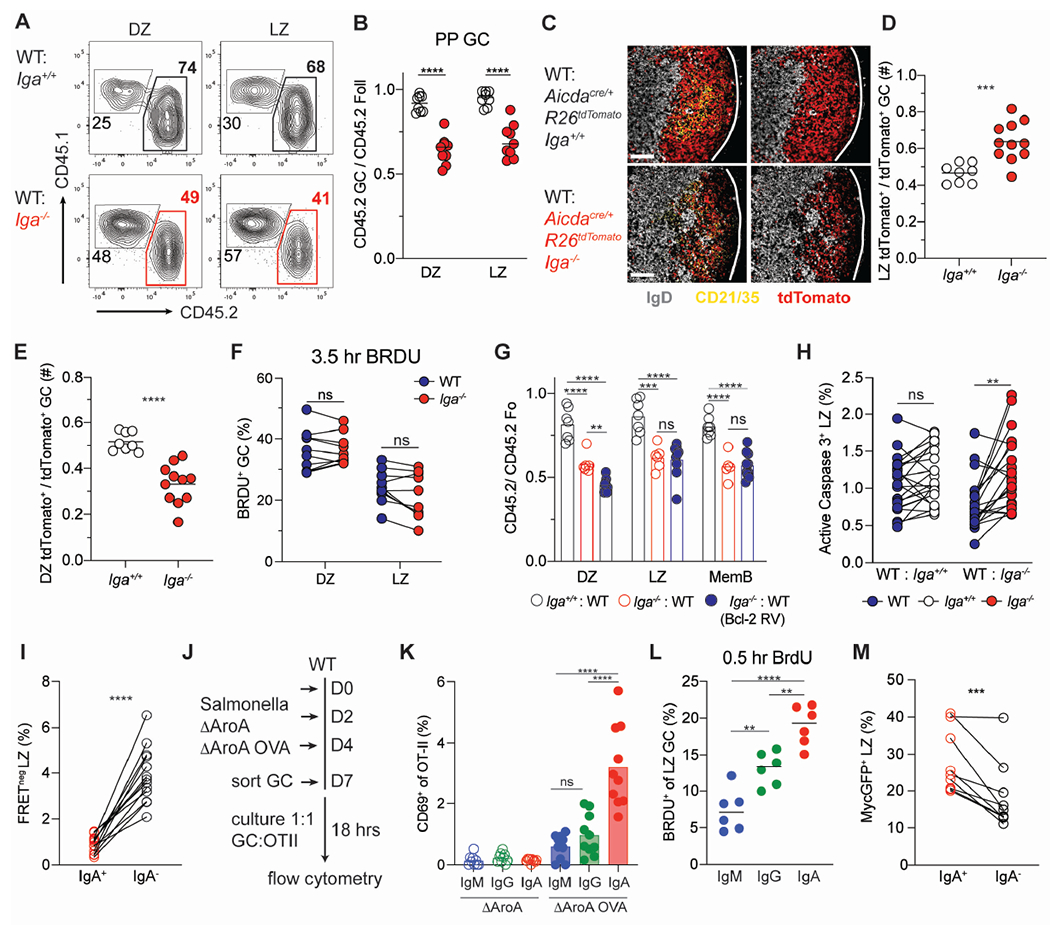
Figure 4. IgA+ B cells exhibit higher cell death resistance and experience stronger T cell-dependent help in GC LZ.

(A) Representative CD45 staining on PP GC LZ (CXCR4lo CD86hi) and DZ (CXCR4hi CD86hi) B cells in mixed BM chimeras.
(B) Ratio of frequency of CD45.2 DZ or LZ B cells to CD45.2 Foll B cells in PP of mixed BM chimeras.
(C) Representative PP immunofluorescence stained for DAPI (gray), tdTomato (red) and CD21/35 (cyan), in WT: Aicdacre/+ Rosa26Stop-tdTomato Iga+/+ or Iga−/− mixed BM chimeras. Scale bars, 100 μm. Lines indicate GC edges with LZ oriented on left, DZ right.
(D, E) Guantification of multiple images as in (C). Ratio of frequency of tdTom+ cells in LZ (D) or DZ (E) to total TdTom+ GC B cells.
(F) Percentage of BrdU+ DZ or LZ GC B cells in PPs of Iga−/− :WT mixed BM chimeras after 3.5 hour BrdU pulse.
(G) Ratio of frequency of indicated CD45.2 B cells to CD45.2 Foll B cells in PP of WT Bcl2: Iga−/− Bcl2 retroviral mixed BM chimeras.
(H) Percentage of active caspase3+ LZ GC B cells in mixed BM chimeras.
(I) Percentage of FRET negative LZ IgA+ and IgA− cells from Rosa26INDIA PPs.
(J) Experimental set up for Salmonella ΔAroA infection and in vitro GC antigen presentation in (K).
(K) Percentage of CD69+ CD4+ OT-II T cells co-cultured with indicated GC B cell isotype. PP GC subsets were sorted according to isotype expression (IgG = IgG1+ or IgG2b+). Mice were infected with Salmonella ΔAroA expressing or not expressing OVA (ΔAroA or ΔAroAOVA). Each symbol is the average of technical replicates from one mouse.
(L) Percentage of BrdU+ LZ GC B cells in PPs for indicated isotypes after 30-minute BrdU pulse. GC subsets were gated according to isotype expression (IgG = IgM− IgA−).
(M) Percentage of cMycGFP+ LZ IgA+ and IgA− B cells from cMyc-GFP PPs
Data are from at least 3 independent experiments with at least 3 mice per group (B, F, H, I, M, K). Data are from 2 experiments with 2-3 mice per group (C-E, G, L). ns=not significant, **p < 0.001; ***p < 0.0005; ****p < 0.0001. Unpaired two-tailed Student’s t-test in B, D, E, F, H, I, M. One-way ANOVA in G, K, L.
See also Figure S3.
