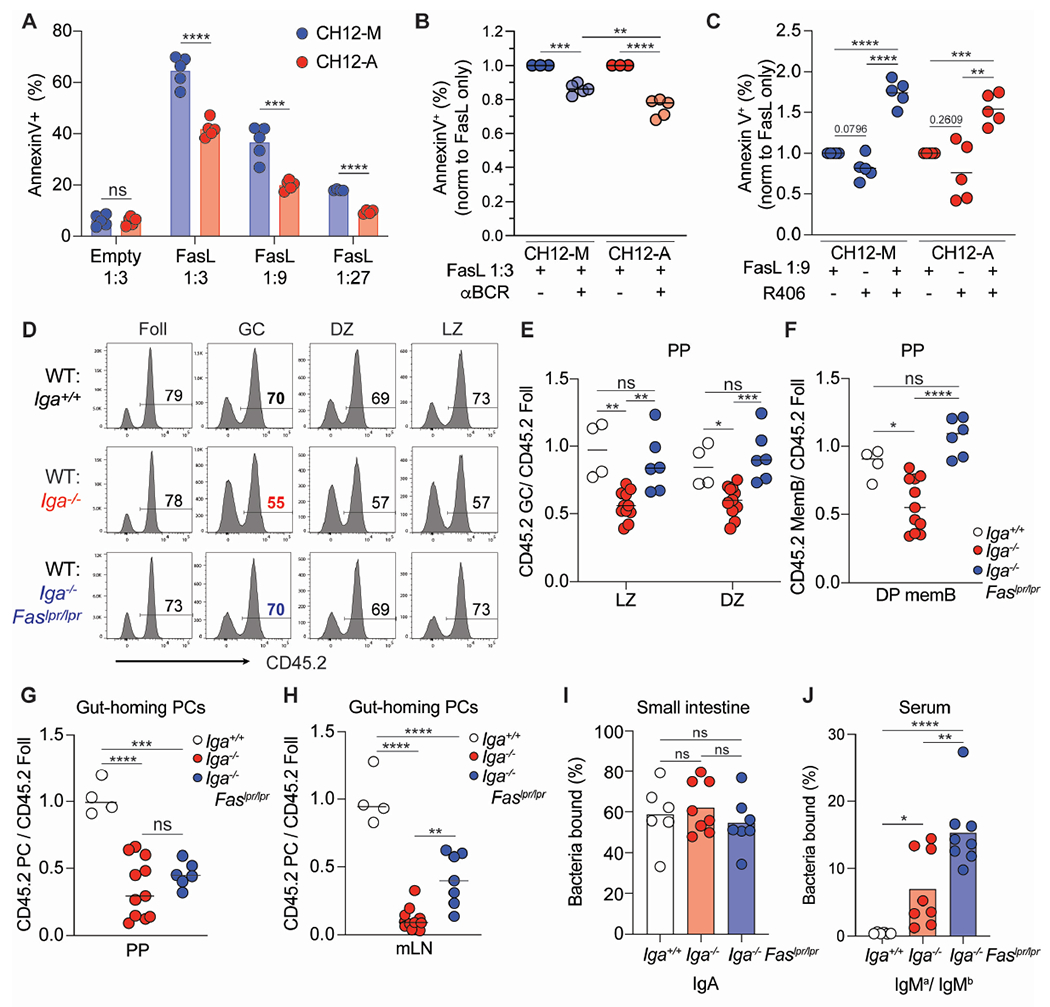
Figure 6. IgA+ GC B cells are more resistant to Fas-dependent counter selection.

(A) Percentage of dead (defined as annexinV+) CH12 cells 5 hours after incubation with FasL vesicles at indicated dilutions.
(B) Percentage of dead CH12 cells after BCR stimulation and incubation with FasL vesicles. Data is normalized to FasL vesicles alone.
(C) Percentage of dead CH12 cells after incubation with R409 and FasL vesicles. Data is normalized to FasL vesicles alone.
(D) Representative histograms of CD45 staining on mixed BM chimeras for indicated B cell populations.
(E) Ratio of frequency of CD45.2 LZ or DZ B cells to CD45.2 Foll B cells in PPs of mixed BM chimeras.
(F) Ratio of frequency of CD45.2 DP memory B cells to CD45.2 Foll B cells from PPs of mixed BM chimeras.
(G, H) Ratio of frequency of CD45.2 gut-homing PCs to CD45.2 Foll B cells from PPs(G) and mLN(H) of mixed BM chimeras.
(I, J) Mixed BM chimeras using μMT hosts to track antibodies using allotypic isotypes. (I) Percentage of endogenously coated small intestinal bacteria with IgA. (J) Percentage of intestinal commensal from μMT mice stained by IgMa or IgMb antibodies from mixed BM serum. Percentage shown as IgMa/IgMb ratio.
A-C are compiled data from at least 3 independent experiments. E-J are compiled data from 3 independent experiments with 1-3 mice per group (E-H) or 2-3 mice per group (I,J). ns=not significant, *p < 0.005; **p < 0.001; ***p < 0.0005; ****p < 0.0001. Unpaired two-tailed Student’s t-test in A. One-way ANOVA in B, C, E-J.
See also Figure S6.
