
FIGURE 6. Time-restricted feeding rescues cognitive behavior and reduces disease progression in the APP-KI AD mouse model.
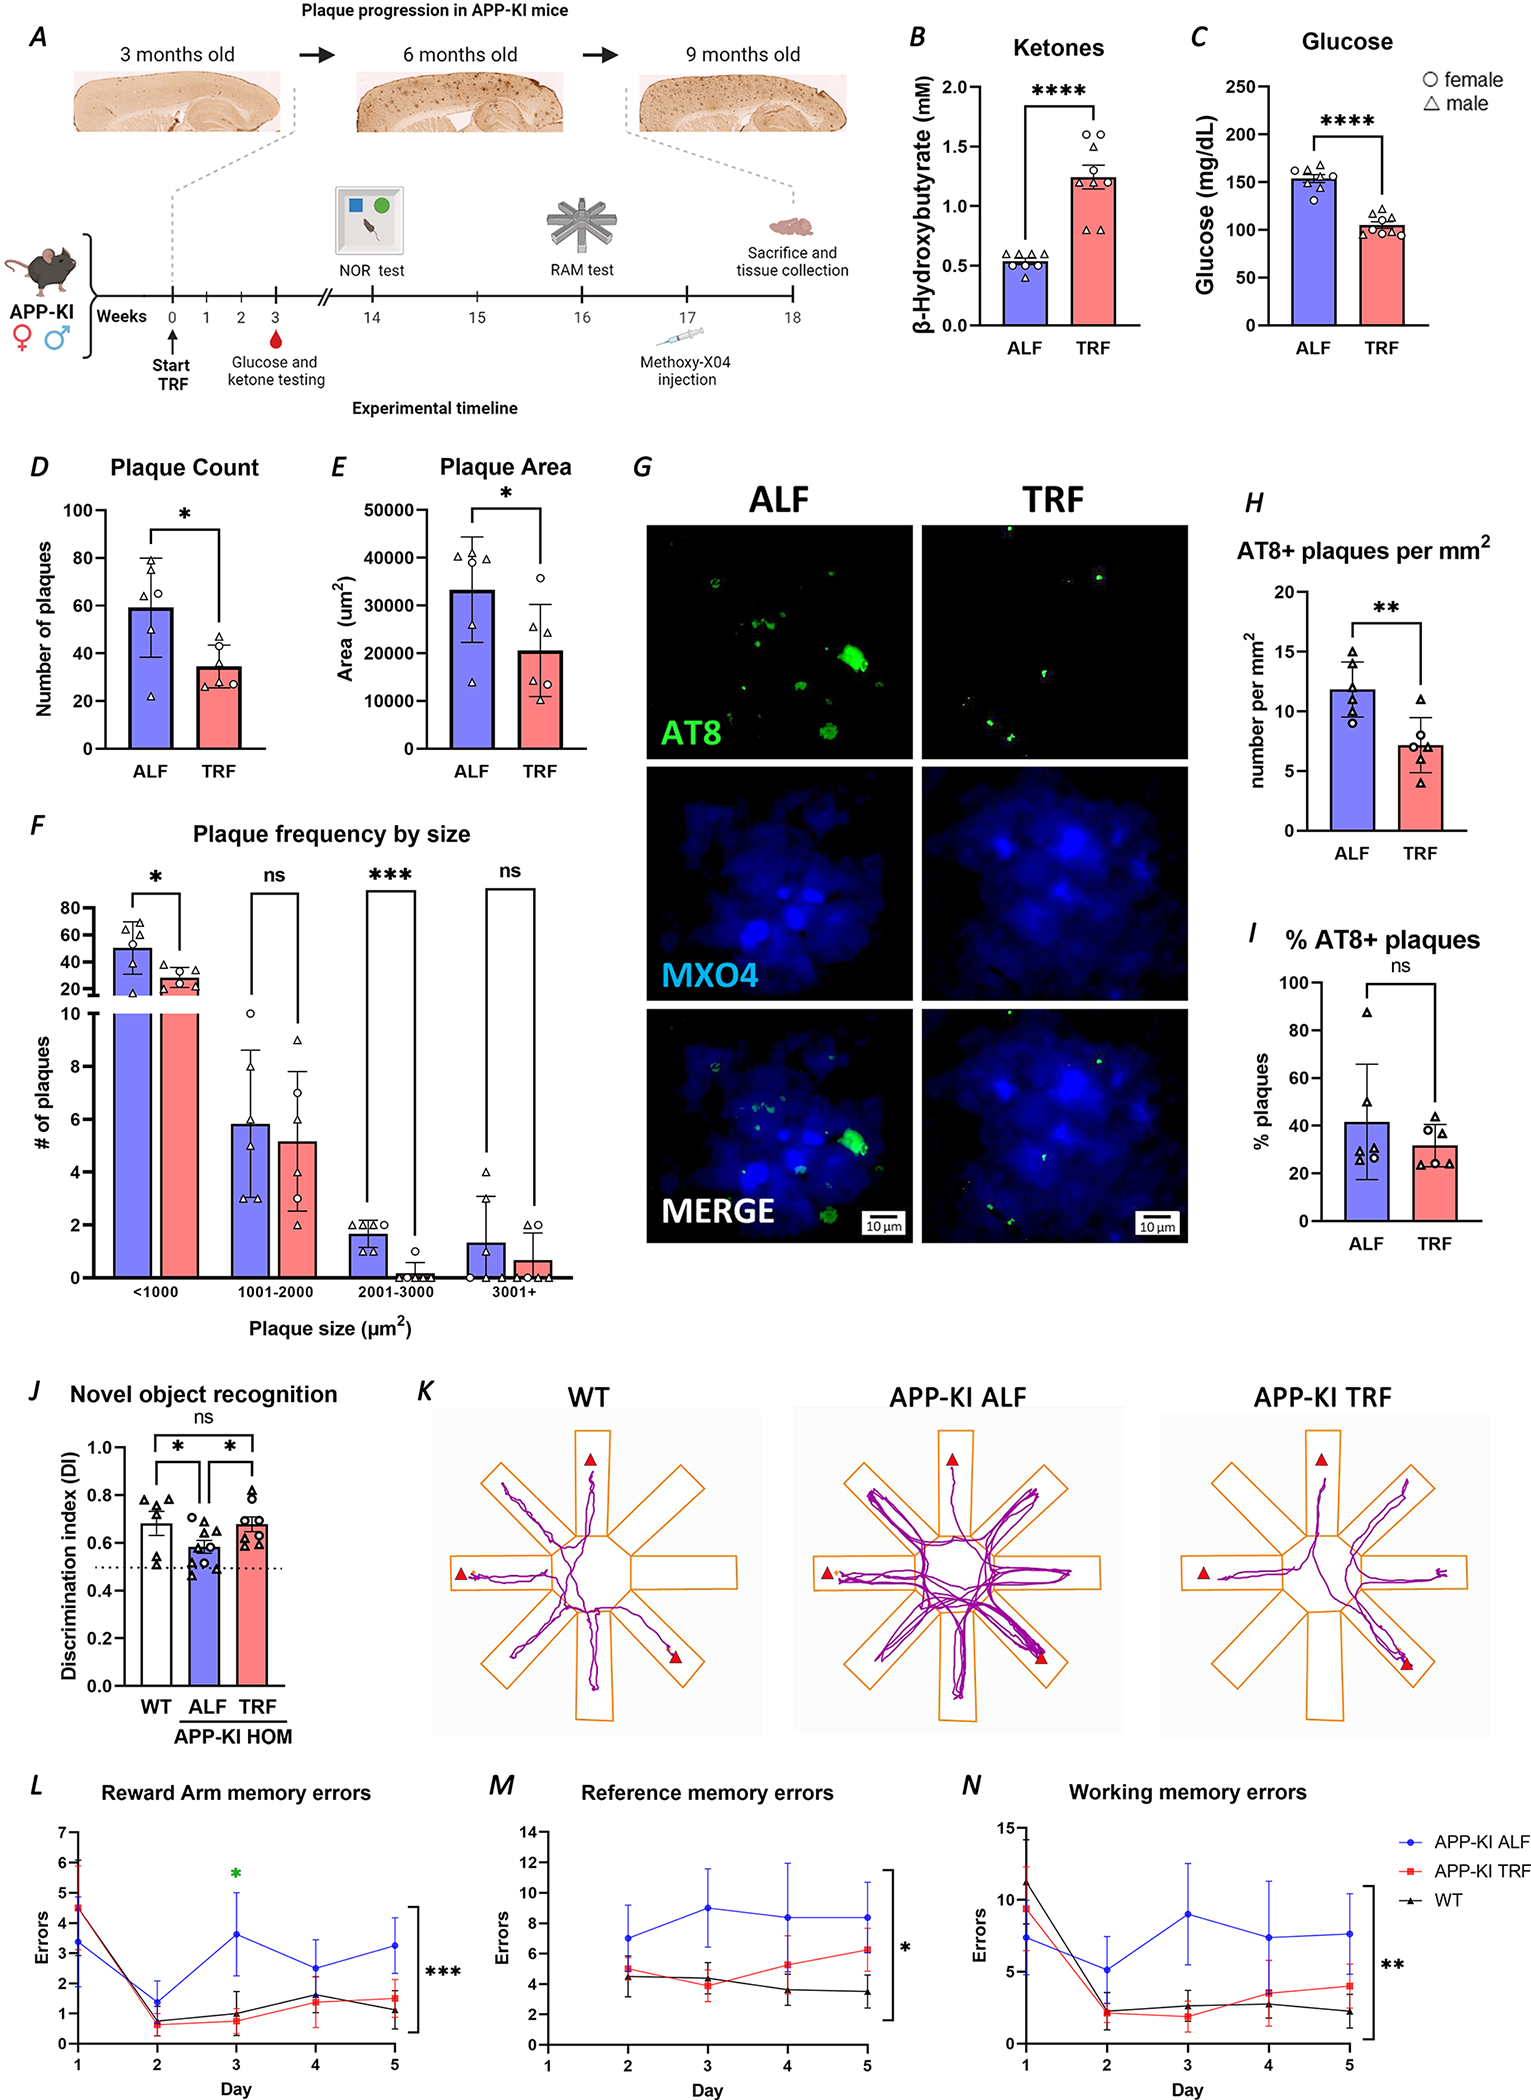
A. Schematic representation of the TRF intervention in APP-KI indicating evaluations performed with relation to timescale of pathology progression. B-C. Significant changes in β-hydroxybutyrate (B) and glucose (C) in APP-KI TRF treated mice (n=9) in comparison to APP-KI ALF mice (n=8), as detected in blood and presented as individual values. D-F. Plaque counts (D) and total plaque area (E) are reduced, and frequency by size (F) shows fewer plaques at any size under TRF. Plaques assessed in Methoxy-X04 injected APP-KI under ALF and TRF at 8.5-months (n=6 per treatment). 20 μm sagittal brain section images were analyzed using ImageJ. G-I. AT8+ puncta co-occurring with plaques was assessed in Methoxy-X04 injected APP-KI under TRF and ALF. Representative images show plaque staining with MX04, P-Tau detected by AT8 antibody and merged images (G). Number of AT8+ plaques per mm2 (H), and the percentage of assessed plaques that are AT8+ (I). J. Learning and memory was tested using the Novel Object Recognition test (n=6 WT; n=10 ALF; n=8 TRF). Values above the dotted line represent greater novel object exploration. K-N. Hippocampal dependent memory deficits were assessed using the Radial Arm Maze (n=8 per condition). Representative trace plots of animal center point for the duration of Radial Arm test on day 3. Red triangles indicate reward arms (K). 5 days of Radial Arm Maze testing showed Reward arm, and total Reference and Working memory errors (L-N). All graphs plotted with standard error of the mean. ◯ female; △ male. Statistical significance as per unpaired Students’ t-test (B-E and H-I), repeat measures two-way ANOVA (F), one-way ANOVA with multiple comparisons (J), multiple unpaired t-tests for APP-KI ALF vs TRF (L), and two-way ANOVA (L-N). *p≤0.05; **p≤0.01; ***p≤0.001; **** p<0.0001.