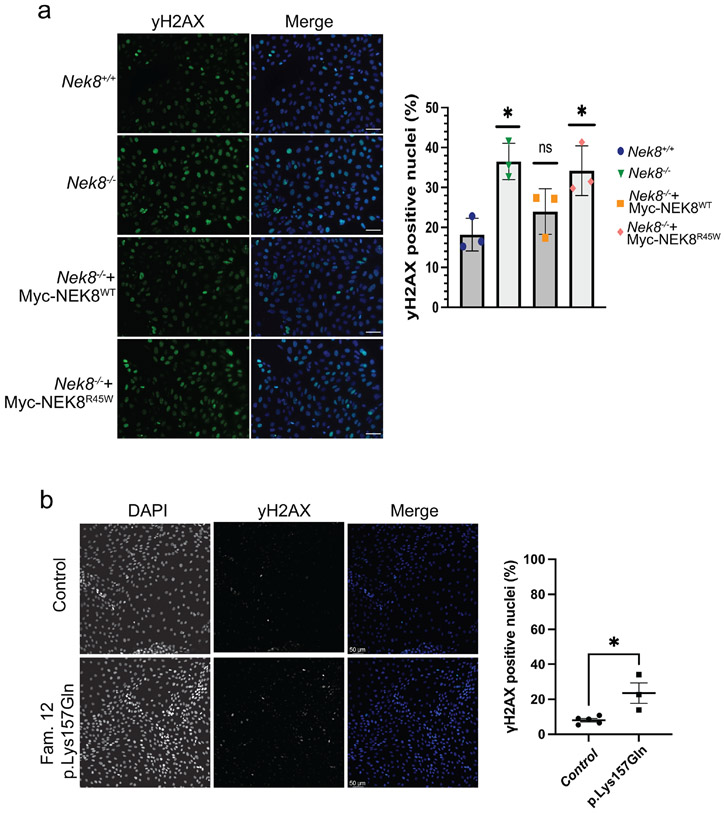
Figure 4. Elevated DNA damage signaling in renal cell lines expressing NEK8 variants.
a. Representative images of γH2AX signaling in IMCD3 cells with the indicated genotypes. Scale bar is 50 μm. Graph represents the mean of three independent experiments. Error bars represent sd. At least 150 nuclei per experiment were analyzed for >10 γH2AX foci, **P <0.01, *P <0.05. b. Representative images of γH2AX signaling in patient derived tubuloids with the indicated genotypes. Scale bar is 50 γm c. The percentage of γH2AX positive cells from three independent experiments was quantified. Line represents the mean. Error bars are sd. **P <0.01, *P <0.05.

