Figure 10:

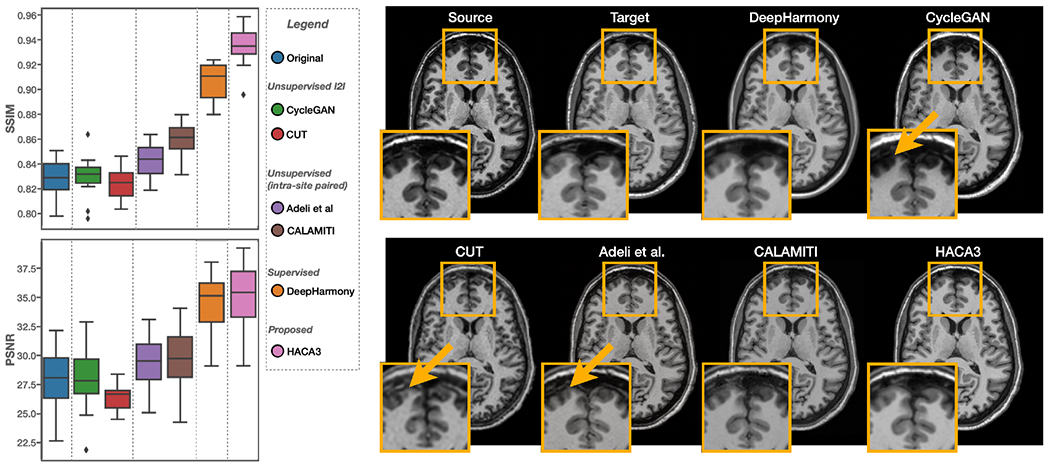
Numerical comparisons between HACA3 (proposed) and other methods using a held-out dataset of inter-site traveling subjects. SSIM and PSNR of T1-w images are calculated. Example T1-w images are shown on the right.

Numerical comparisons between HACA3 (proposed) and other methods using a held-out dataset of inter-site traveling subjects. SSIM and PSNR of T1-w images are calculated. Example T1-w images are shown on the right.