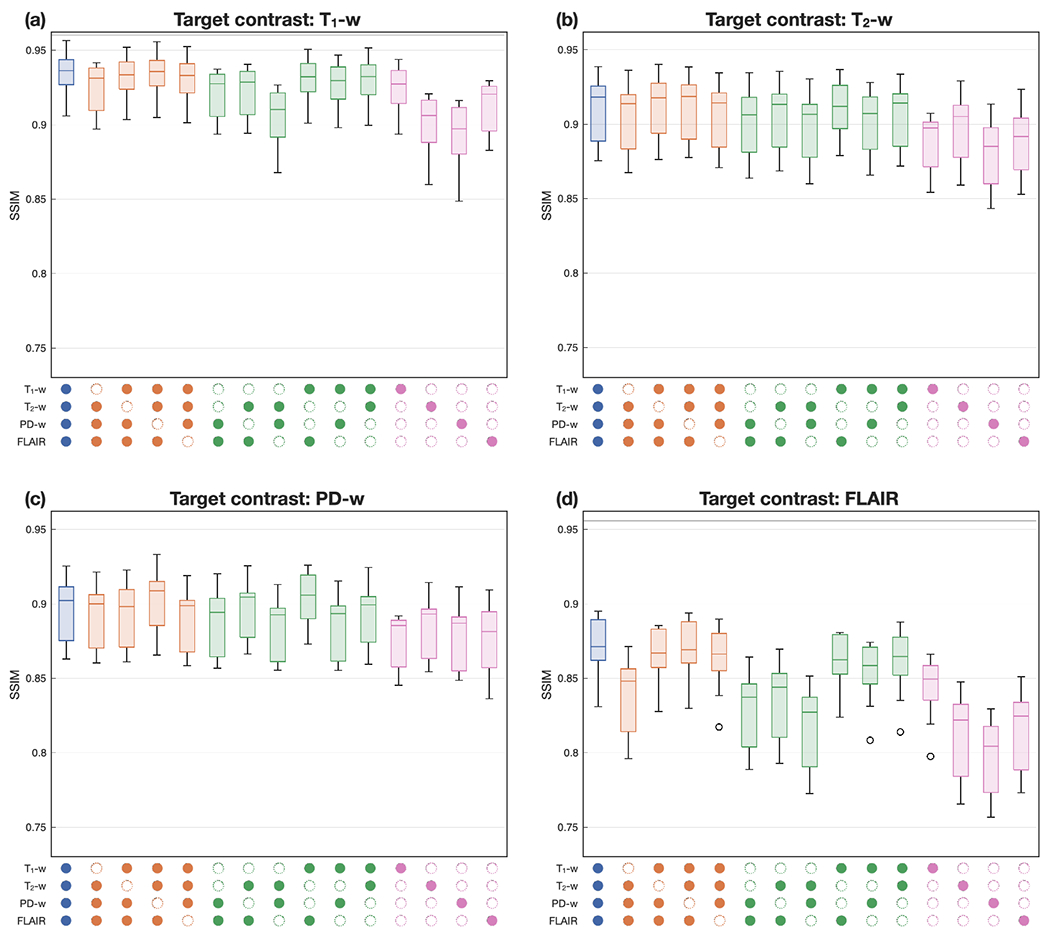
Figure 11:

HACA3 handling different availability of source images. From (a) to (d): target image being T1-w, T2-w, PD-w, and FLAIR images, respectively. Colored boxplots represent different numbers of source images. The panel below the boxplots indicates which images were used as input to the harmonization (with an empty circle indicating the absence of a particular contrast).
