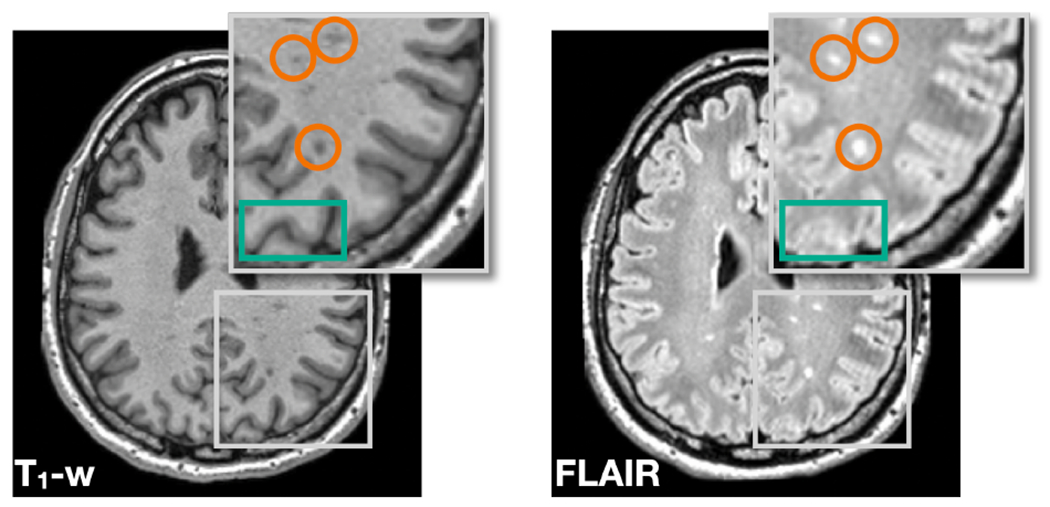
Figure 2:

T1-w and FLAIR images of a MS subject reveal slightly different anatomical features. The T1-w image shows better contrast between GM, WM, and cerebrospinal fluid (highlighted by the green box), while the FLAIR image shows clearer boundaries for the WM lesions (highlighted by the orange circles).
