
Figure 1. Construction of the new algorithm, the predicted immunophenotypes (predicted IP) via two signature gene sets.
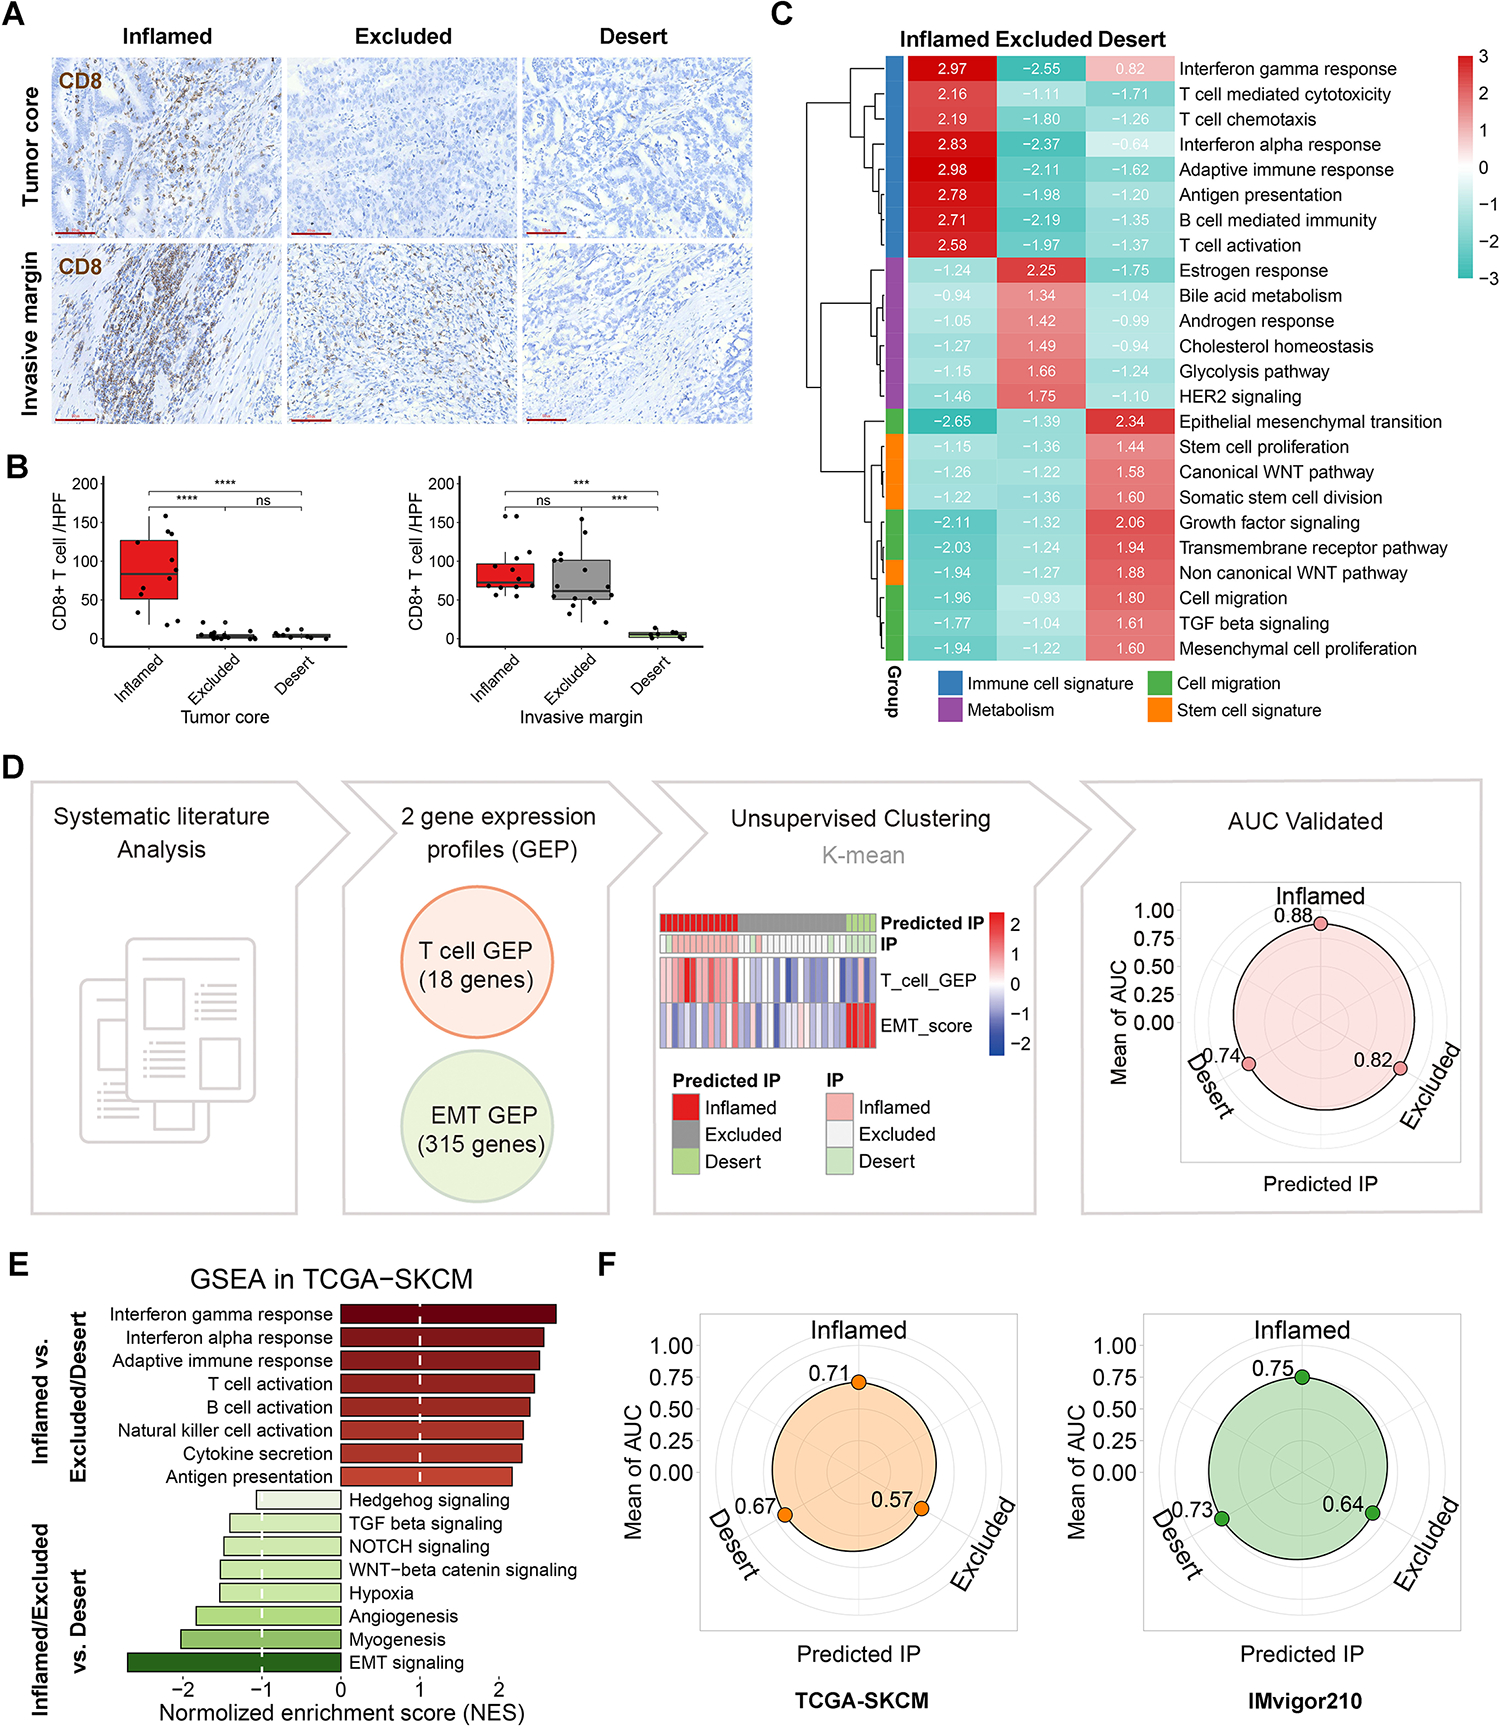
(A) Representative immunohistochemistry staining (scale bars, 80μm) of CD8 in tumor core and invasive margin of 36 human gastric tumors. (B) The quantification of CD8+ T cell per tumor (the black spot) was shown as the mean value of 3 independent high-power fields (HPF) in tumor. ns indicate no significance, **p < 0.01, ***p < 0.001, ****p < 0.0001. (C) Gene set enrichment analysis (GSEA) was employed in the local cohort, using a panel of functional gene sets from GO biological processes item and hallmarks item in MSigDB database of the Broad Institute. The values indicate normalized enrichment score (NES). (D) Unsupervised clustering of the 36 tumors was performed using the scores of T cell gene expression profile (GEP) and EMT signature. The predictive performance was verified by area under curve (AUC) of receiver operating curve analysis. (E) GSEA was performed in TCGA SKCM cohort. (F) The predictive performances of TCGA SKCM cohort and IMvigor210 cohort.