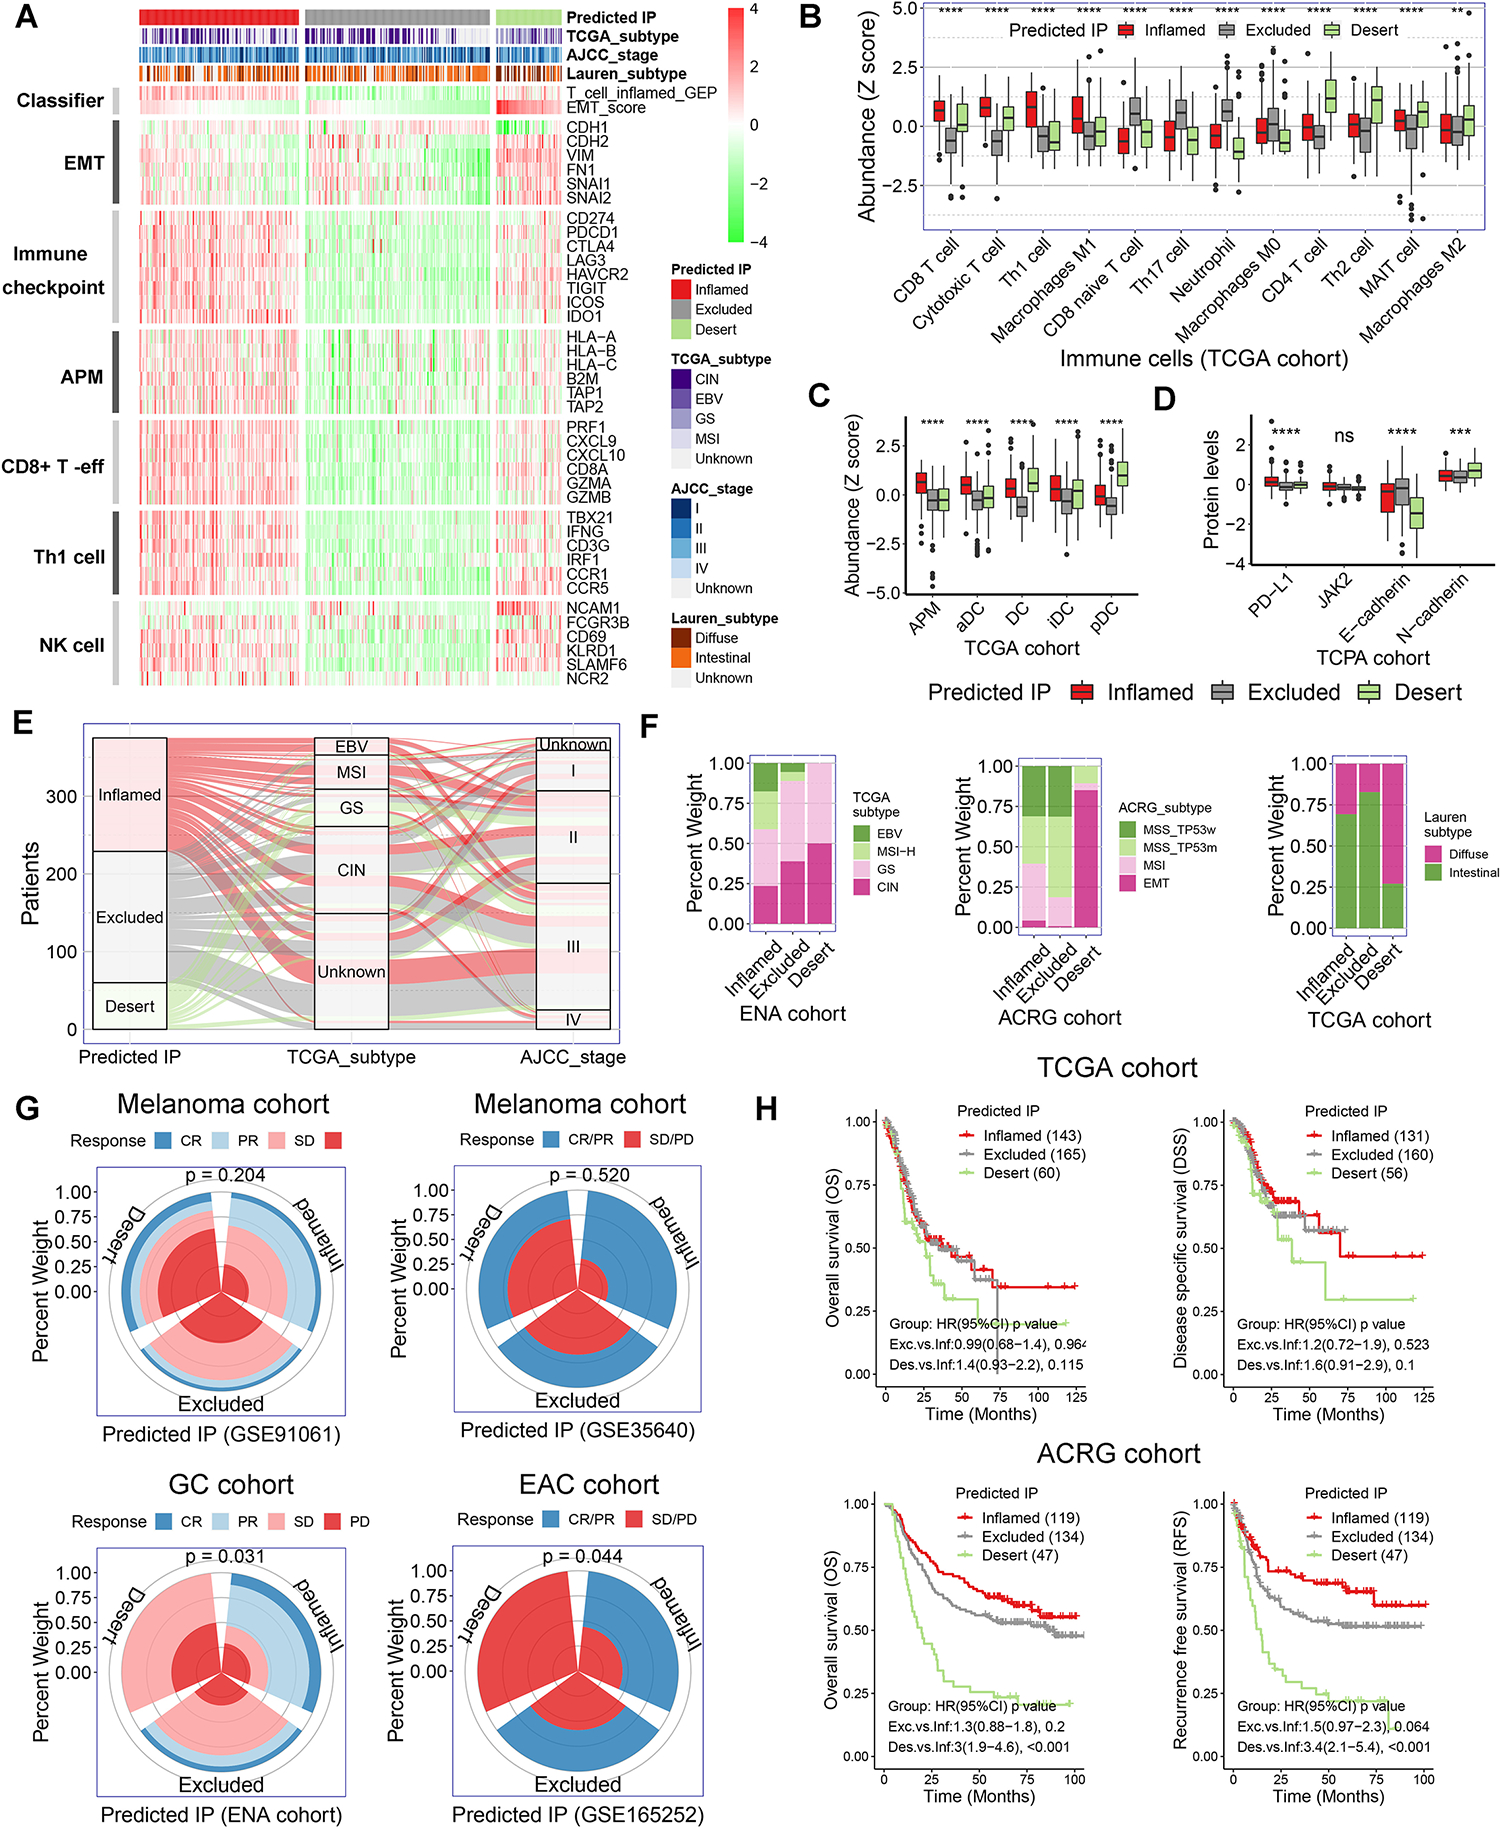
Figure 2. Variation of clinical features, immunotherapeutic response and prognosis among the subtypes of predicted immunophenotype.

(A) Heatmap presented the expression of marker genes in the critical functional gene sets in TCGA gastric cancer cohort. The TCGA gastric cancer cohort were stratified as inflamed-type, excluded-type, and desert-type tumors by our predicted immunophenotype (predicted IP). AMP, antigen-presenting machinery. (B) The abundance of immune cells was evaluated by the immune cell abundance identifier (ImmuCellAI) and CIBERSORT tools in TCGA gastric cancer cohort. The values were normalized into Z score. (C) The abundance of various population of dendritic cells (DCs) in TCGA gastric cancer cohort. (D) Relative protein levels of PD-L1, JAK2, E-cadherin and N-cadherin in The Cancer Proteome Atlas (TCPA) gastric cancer cohort. (E and F) Correlation of predicted IP with clinicopathological characteristics in gastric cancer cohorts. (G) Immunotherapeutic response rate among the subtypes of predicted IP in ENA and three GEO cohorts (p = 0.204 for GSE91061, p = 0.520 for GSE35640, p = 0.031 for ENA cohort and p = 0.044 for GSE165252). (H) Kaplan-Meier survival analysis for patients with different predicted IP in TCGA and ACRG gastric cancer cohorts.
