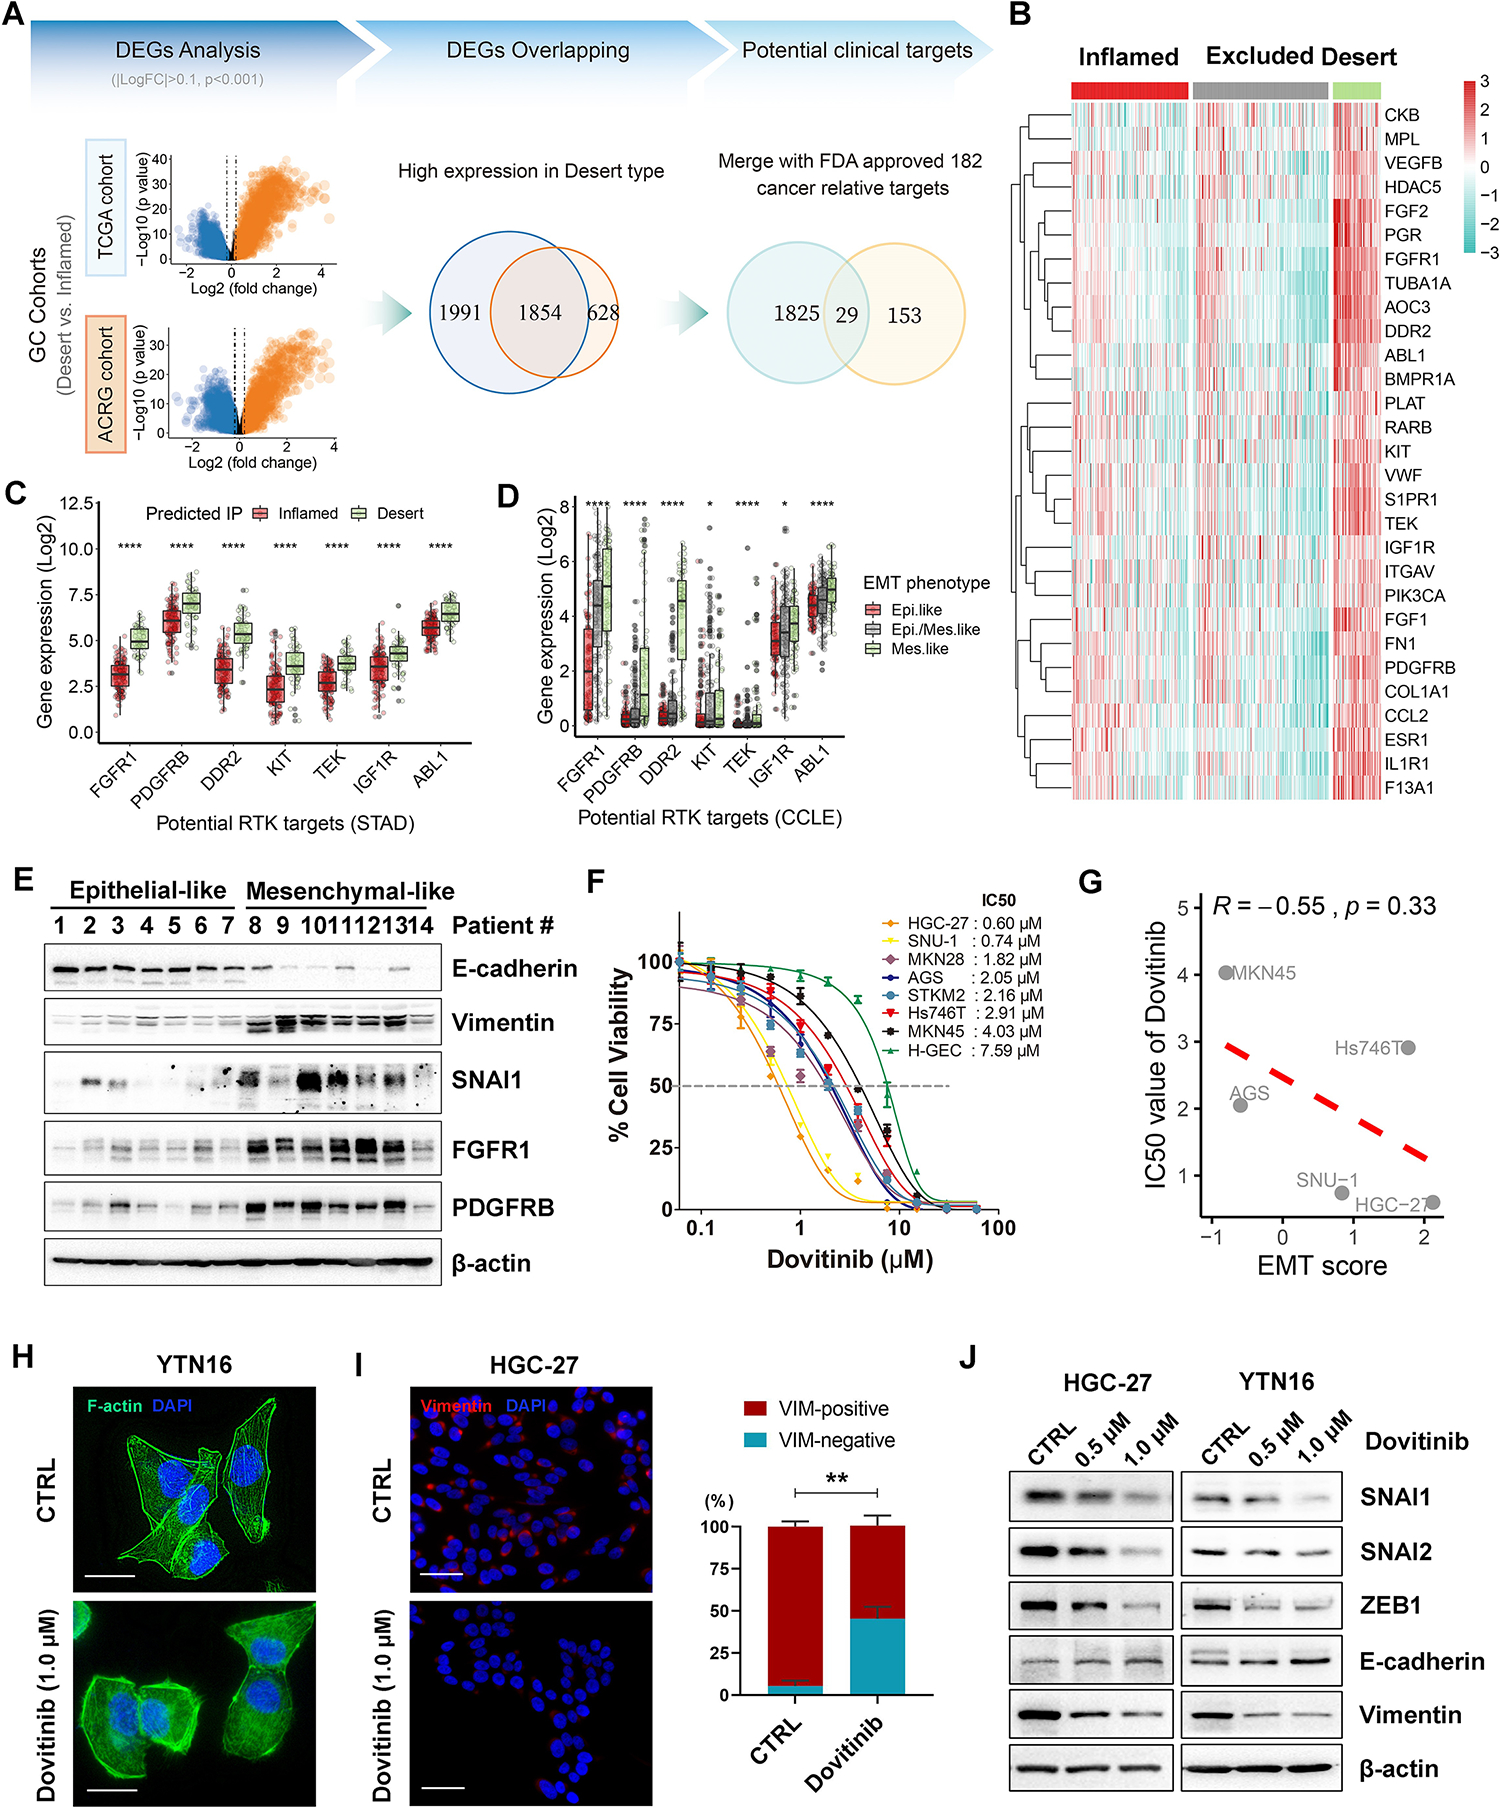
Figure 3. Dovitinib inhibits EMT program in mesenchymal-like gastric cancer cells.

(A) Differentially expressed genes (DEGs) analysis were performed by comparing the predicted desert-type tumors with the predicted inflamed-type tumors in both TCGA and ACRG (GSE66229) cohorts. The 1854 common DEGs that are highly expressed in the desert tumors of TCGA and ACRG cohorts were selected for the overlapping with 182 FDA approved cancer-relative-targets (obtained from the Human Protein Atlas). (B) Gene expression heatmap of the final 29 DEGs that were identified as potential targets in the desert-type tumors in TCGA cohort. (C and D) The relative mRNA expression of a group of receptor tyrosine kinases (RTKs) in the desert-type tumors in TCGA STAD (gastric cancer) cohort, compared to the inflamed-type tumors (C), or in the mesenchymal-like cancer cell lines from CCLE database, compared to the epithelial-like cancer cell lines (D). (E) Western blots for E-cadherin, Vimentin, SNAI1, FGFR1 and PDGFRB in 14 cases of human gastric tumor samples. (F) ATP-Glo assays showed the IC50 curves of dovitinib in a panel of human gastric cancer cell lines and one human gastric epithelial cell line (H-GEC). (G) Pearson’s correlation between EMT score and IC50 value of dovitinib in the five accessible gastric cancer cell lines (R = −0.55, p = 0.33). (H) Phalloidin staining (scale bars, 25μm) for F-actin (green) and DAPI (blue) in YTN16 cells under vehicle control (CTRL) or dovitinib (1.0μM) treatment. (I) Immunofluorescence staining (scale bars, 50μm) for Vimentin (red) and DAPI (blue) in HGC-27 cells under vehicle control (CTRL) or dovitinib (1.0μM) treatment. The quantification of Vimentin-positive and -negative cells was shown as the mean ± SD of 3 independent fields, normalized to total cells (%); **p < 0.01. (J) Western blots for E-cadherin, Vimentin, SNAI1/2 and ZEB1 in HGC-27 and YTN16 cells under vehicle control and dovitinib treatment (0.5μM or 1.0μM).
