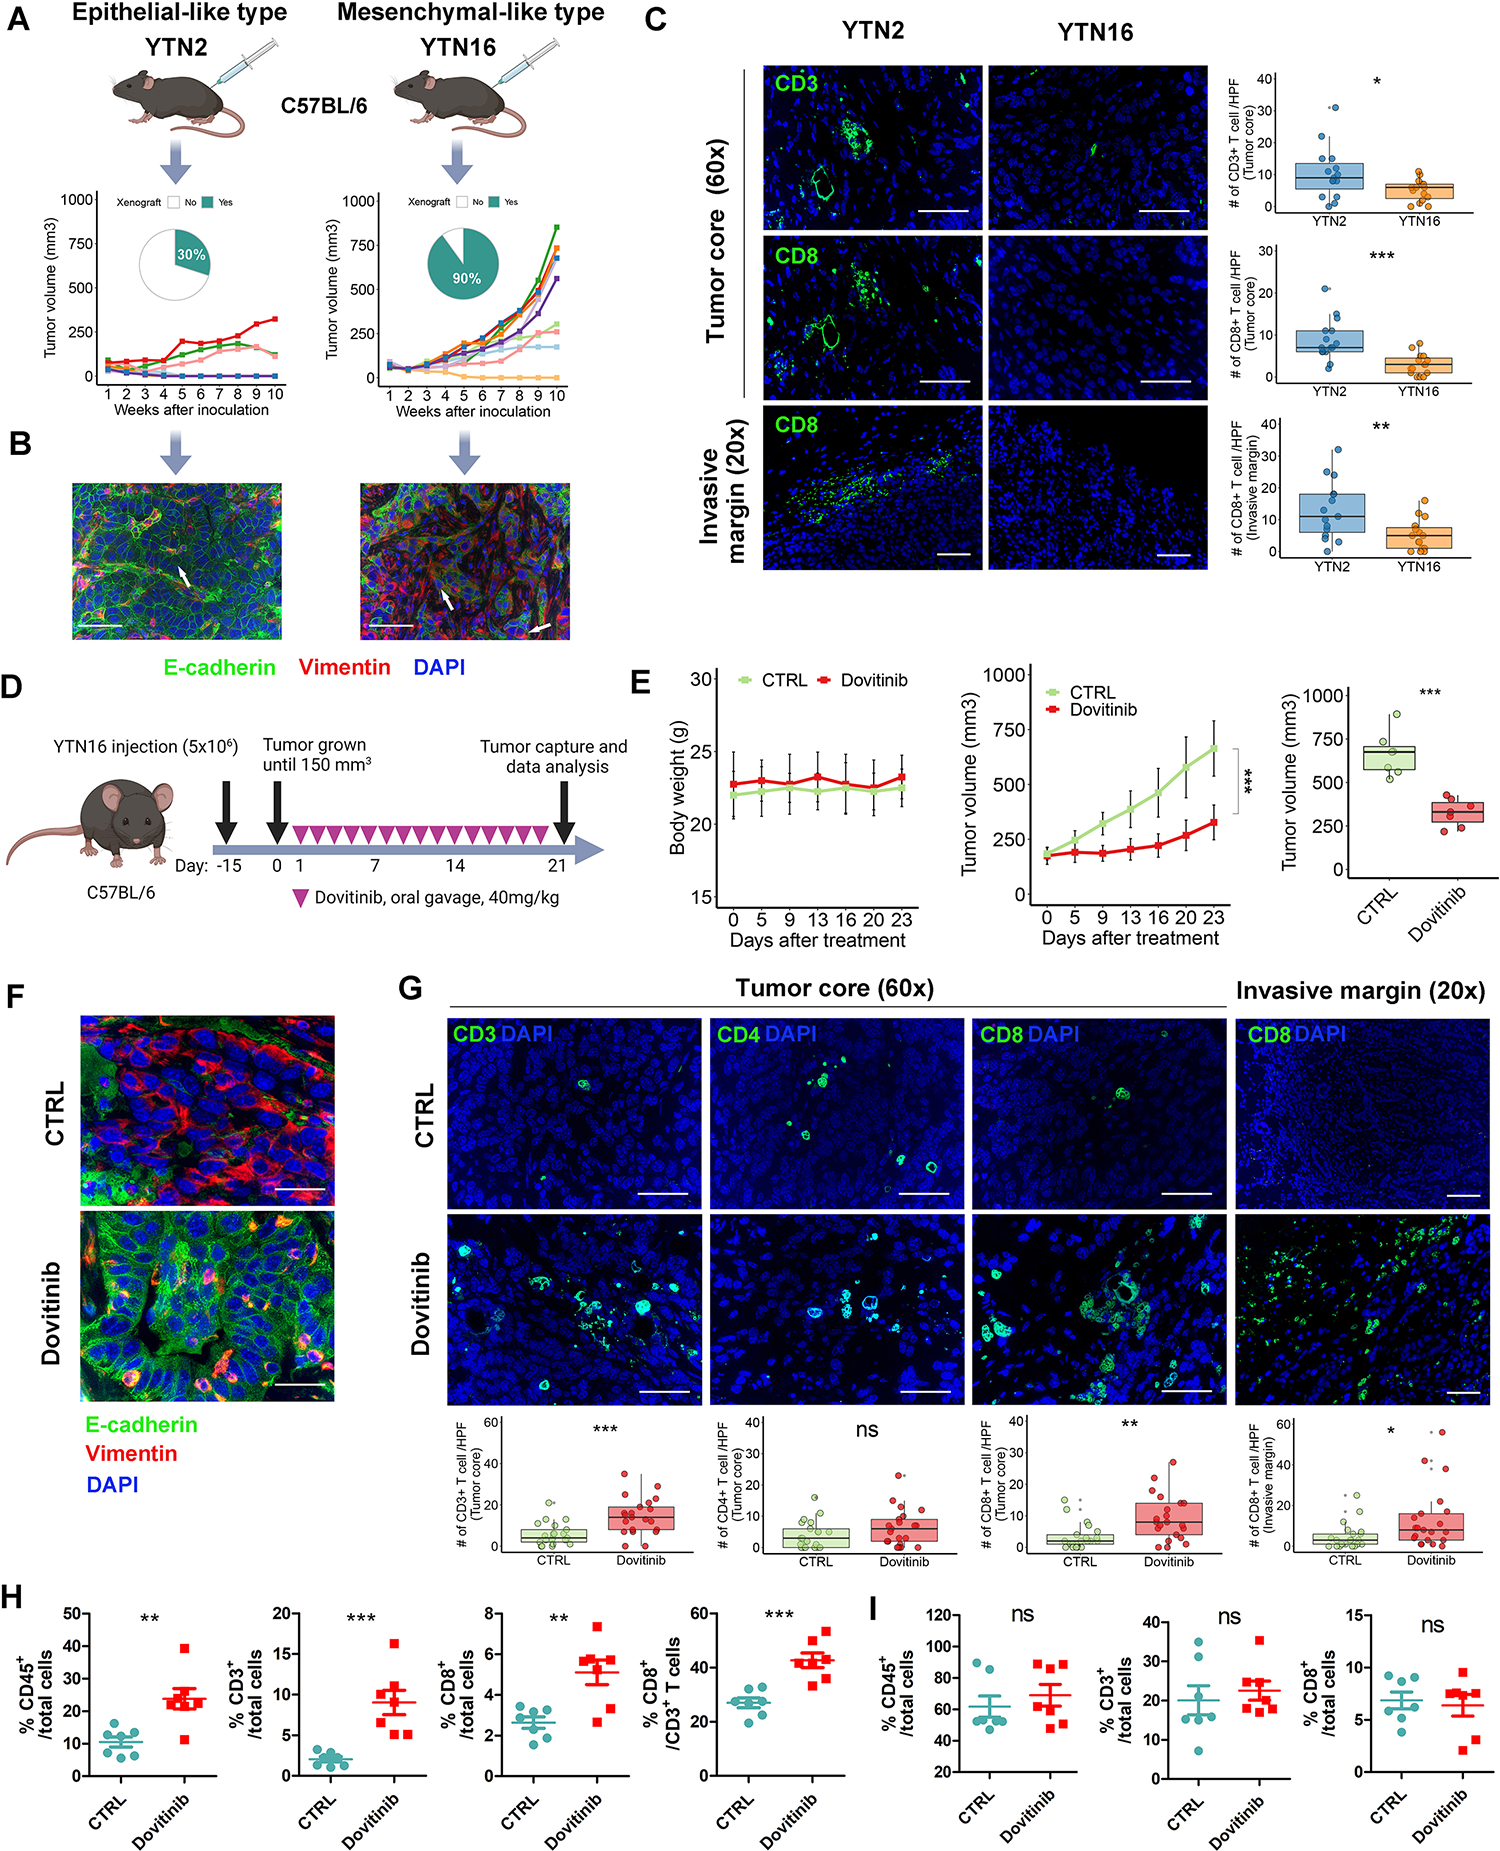
Figure 4. Dovitinib reprograms TME by promoting CD8+ T cell recruitment.

(A) Tumor initiation rate and tumor volume of syngeneic tumors derived from YTN2 and YTN16 cells. Each group included 10 tumors. (B) Immunofluorescence staining (scale bars, 50μm) for E-cadherin (green), Vimentin (red) and DAPI (blue) in the relevant tumors. White arrows indicate representative staining of tumor cells. (C) Immunofluorescence staining (scale bars, 50μm) for CD3/CD8 (green) and DAPI (blue) in tumor core or invasive margin in the syngeneic tumors from (A). The quantification of CD3+/CD8+ T cells were shown as the cell numbers of 3 independent high-power fields for each tumor. Each group included 5 tumors. (D) A schematic view of the treatment plan for the syngeneic tumors derived from YTN16 cells. (E) Plots of mice body weight (Left) and tumor volumes (Middle), which were measured twice per week. The box whisker plots of the tumor volumes on day23 were shown (Right). Each group included 7 tumors. (F and G) Immunofluorescence staining (scale bars, 50μm) for E-cadherin/Vimentin/DAPI in tumor core (F), or CD3/CD4/CD8/DAPI in the core or invasive margin (G) of the syngeneic tumors from (E). The quantification of T cells shown as the cell numbers of 3 independent high-power fields for each tumor (bottom). (H and I) Flow cytometry analysis for CD45+/CD3+/CD8+ T cells in syngeneic tumors (H) and relevant mouse spleens (I). A one-way ANOVA test was performed for the between-group difference. ns indicate no significance, **p < 0.01, ***p < 0.001.
