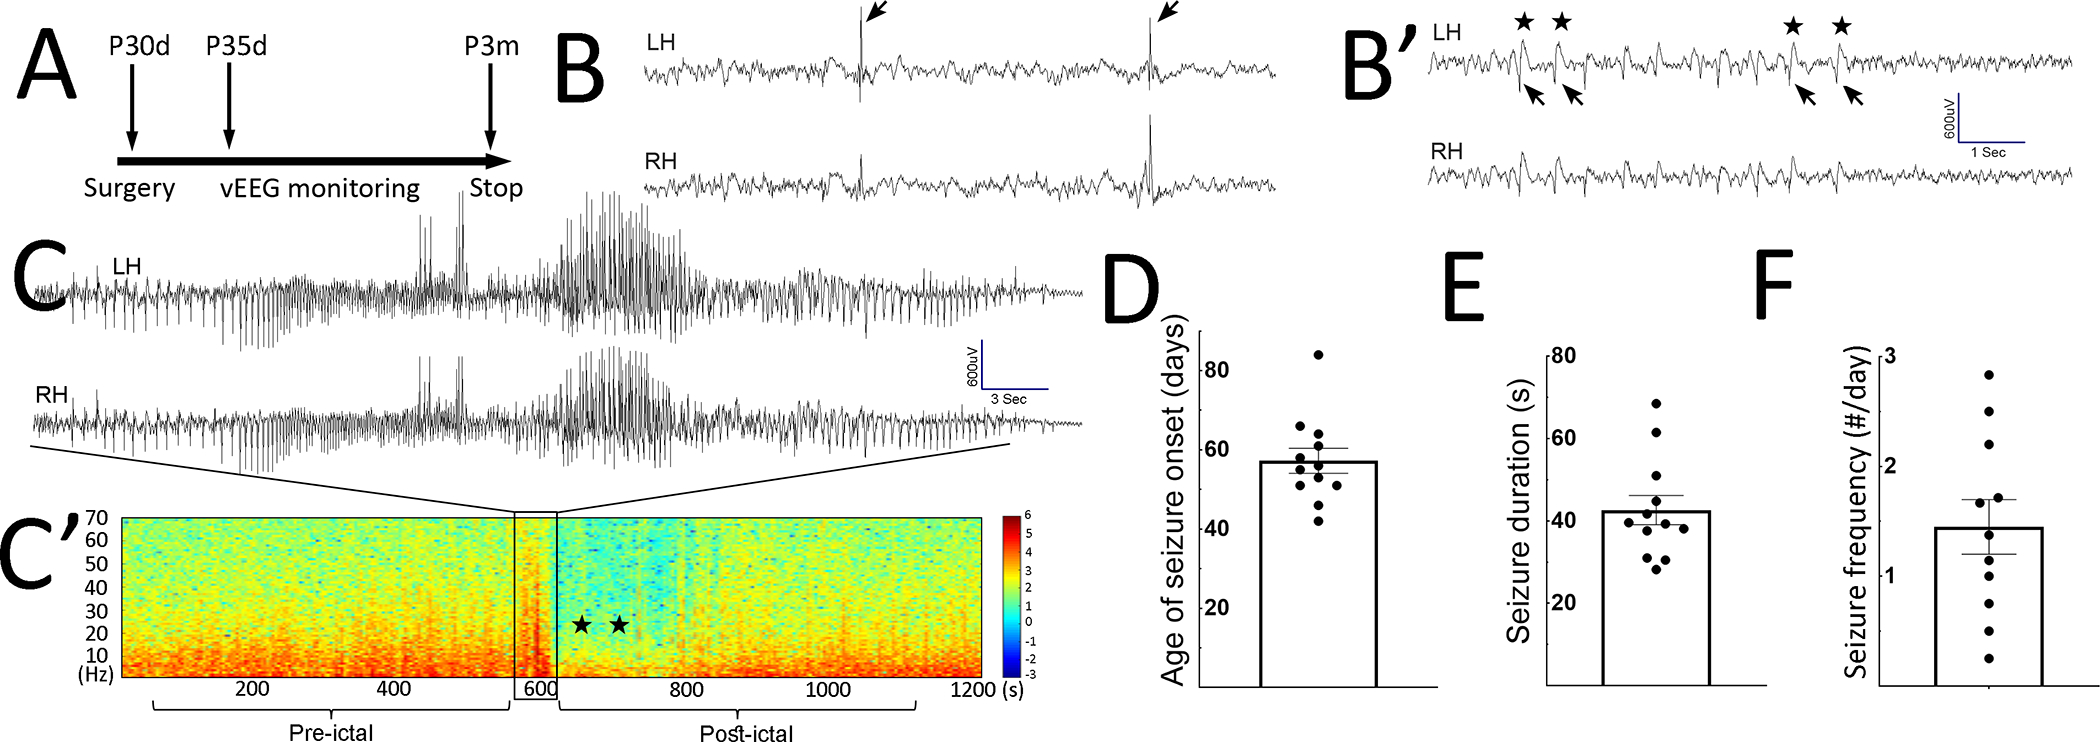
Figure 2. Rbp4-Cre; Depdc5F/FCKO mice develop spontaneous generalized tonic-clonic seizures.

A) Timeline of continuous video-EEG monitoring experiments. EEG implantation was performed between P30–31 days (d). vEEG started 5 days after implantation and continues until P3 months (m). B, B’) Representative examples of interictal epileptiform discharges (IED), including singly occurred spikes in B) and periodic spike-and-wave discharges in B’). In B’) arrows indicate spikes, and stars indicate the after-going slow waves. LH: left hemisphere; RH: right hemisphere. C) Representative EEG trace during generalized tonic-clonic seizures. C’) Representative spectrogram during the pre-ictal, ictal, and post-ictal stages. The boxed area displays a surge of increased power across all frequency bands, representing the seizure in C). Postictally, decreased power in all frequency bands (stars) is evident and represents EEG background suppression, lasting up to 200 seconds (s). The background then gradually recovers. D-F) Age of seizure onset: 57.25 ± 3.16 postnatal days (n=12), seizure duration (42.65 ± 3.544 sec, n=12), and seizure frequency (1.45 ± 0.25 per day, n=11).
