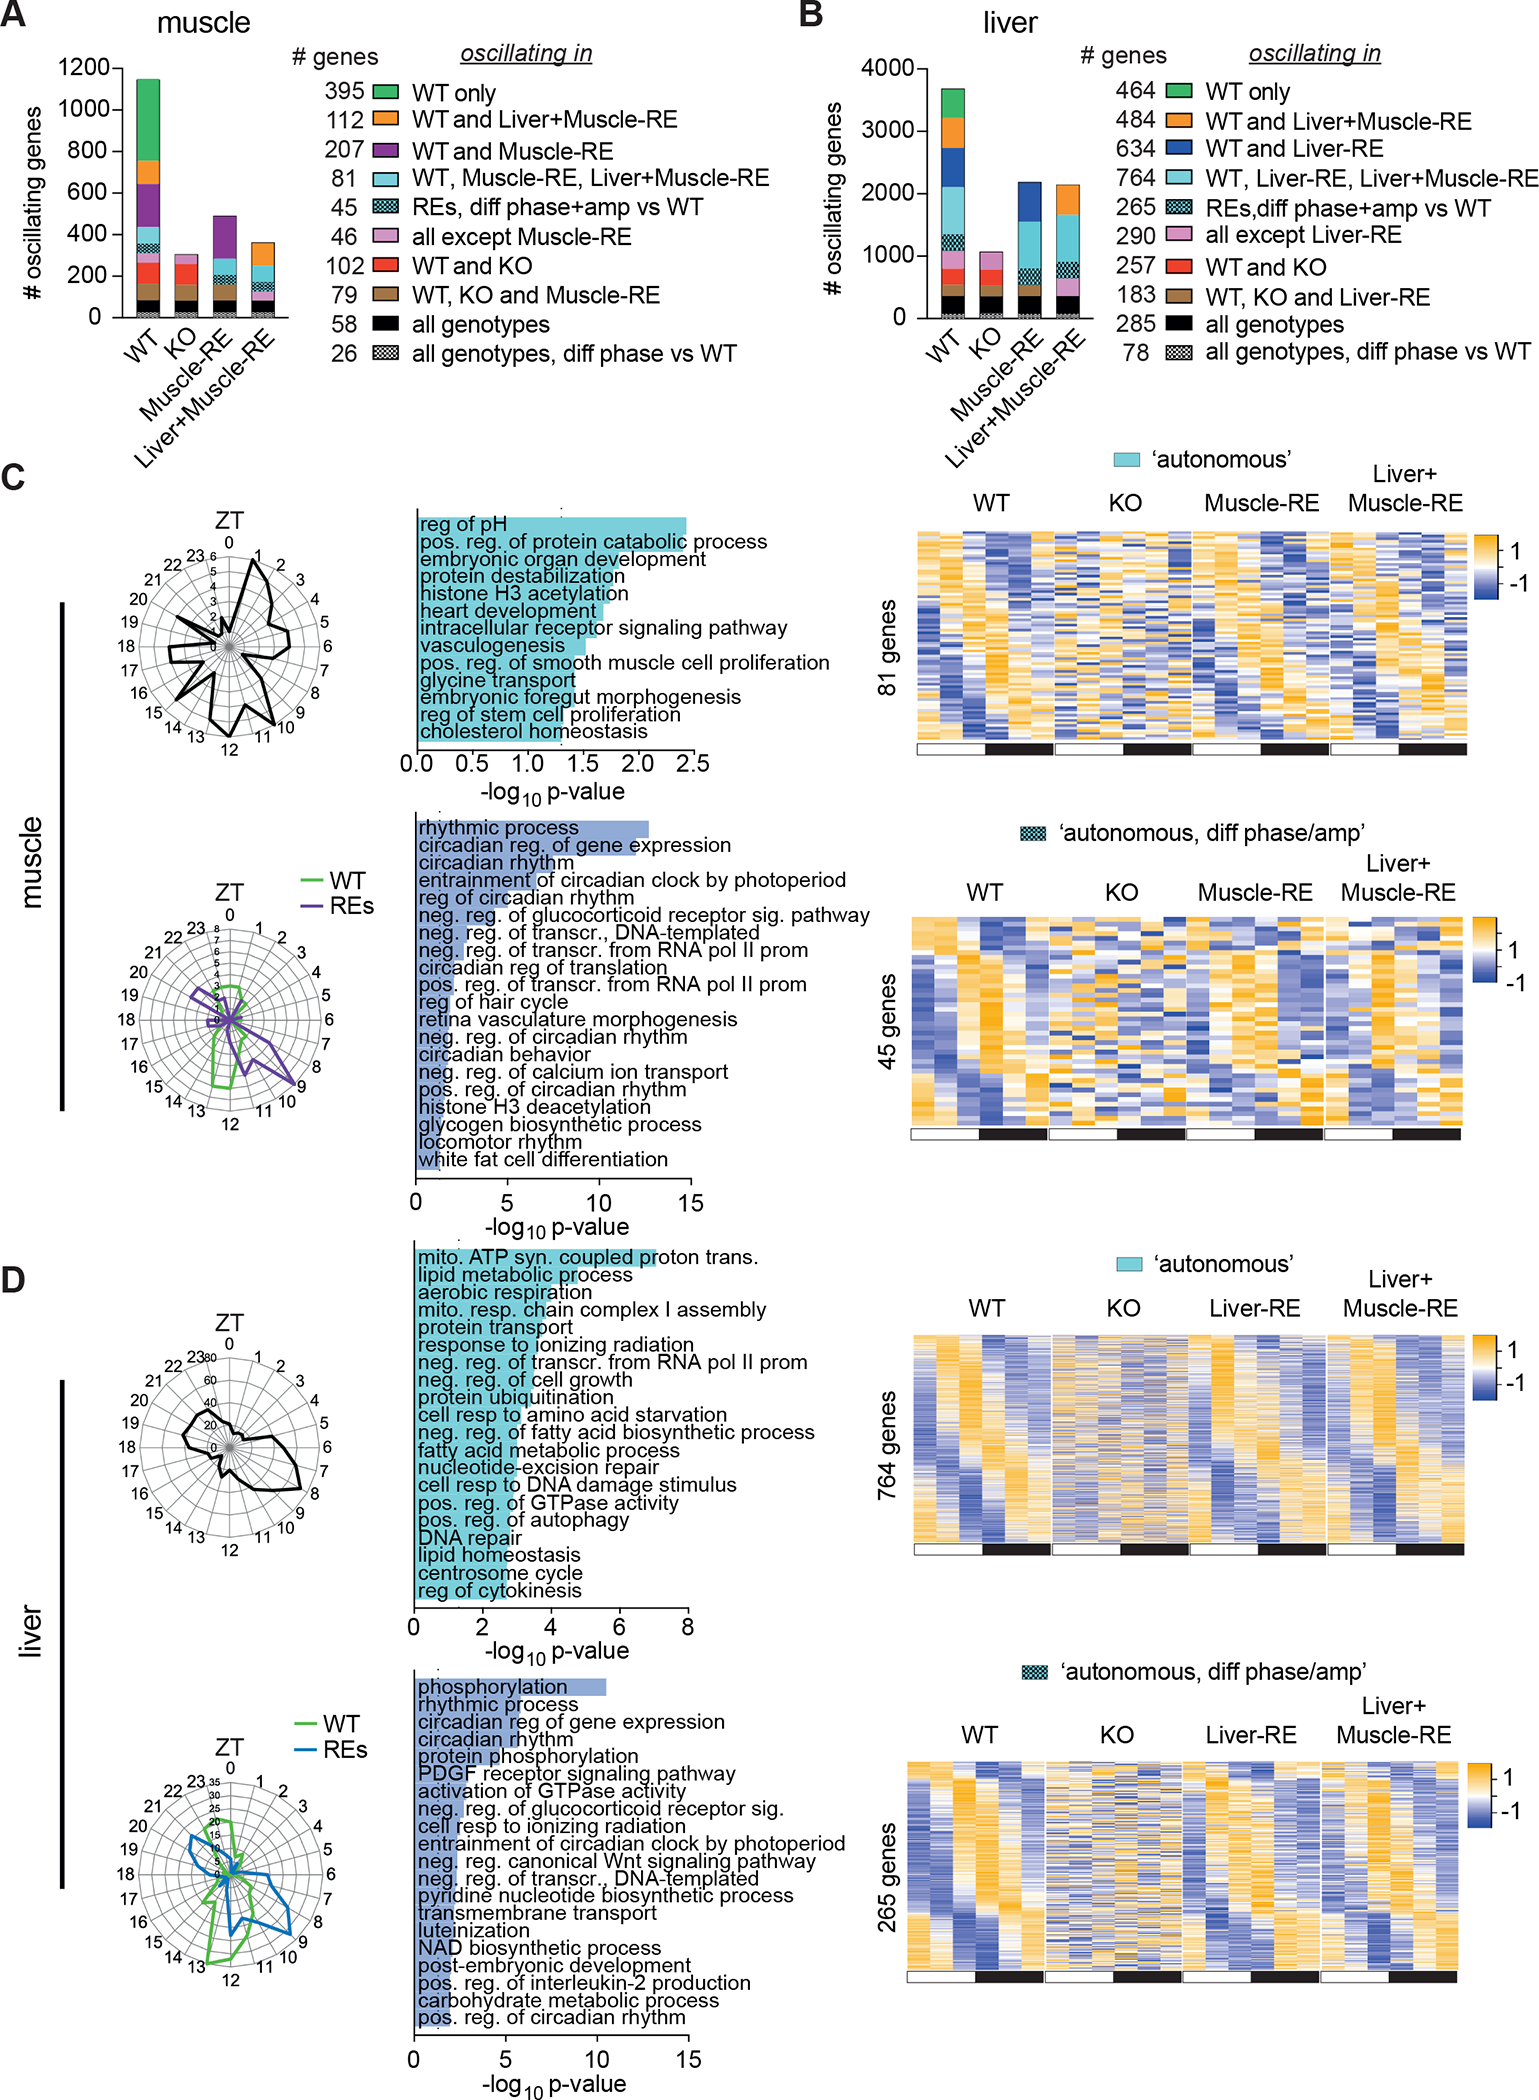
Figure 3. Local clocks in muscle and liver drive distinct autonomous outputs.

(A–D) RNA-seq of gastrocnemius muscle and liver harvested around the clock, 12 h light/12 h dark conditions, n = 3. ZT, zeitgeber time; ZT0, lights on; ZT12, lights off.
(A, B) Top 10 dryR models.
(C and D) Oscillating genes in muscle (C) and liver (D) by dryR. Left, polar histogram, peak phases. Middle, DAVID biological process enrichments, some pathway names abbreviated. Right, heatmaps of group averages sorted by WT peak phase. Top, autonomously oscillating genes. Bottom, autonomously oscillating genes with difference phase and amplitude in RE mice.
