
Figure 5. Liver and muscle clocks are partially sufficient for control of glucose metabolism at the tissue but not systemic level.
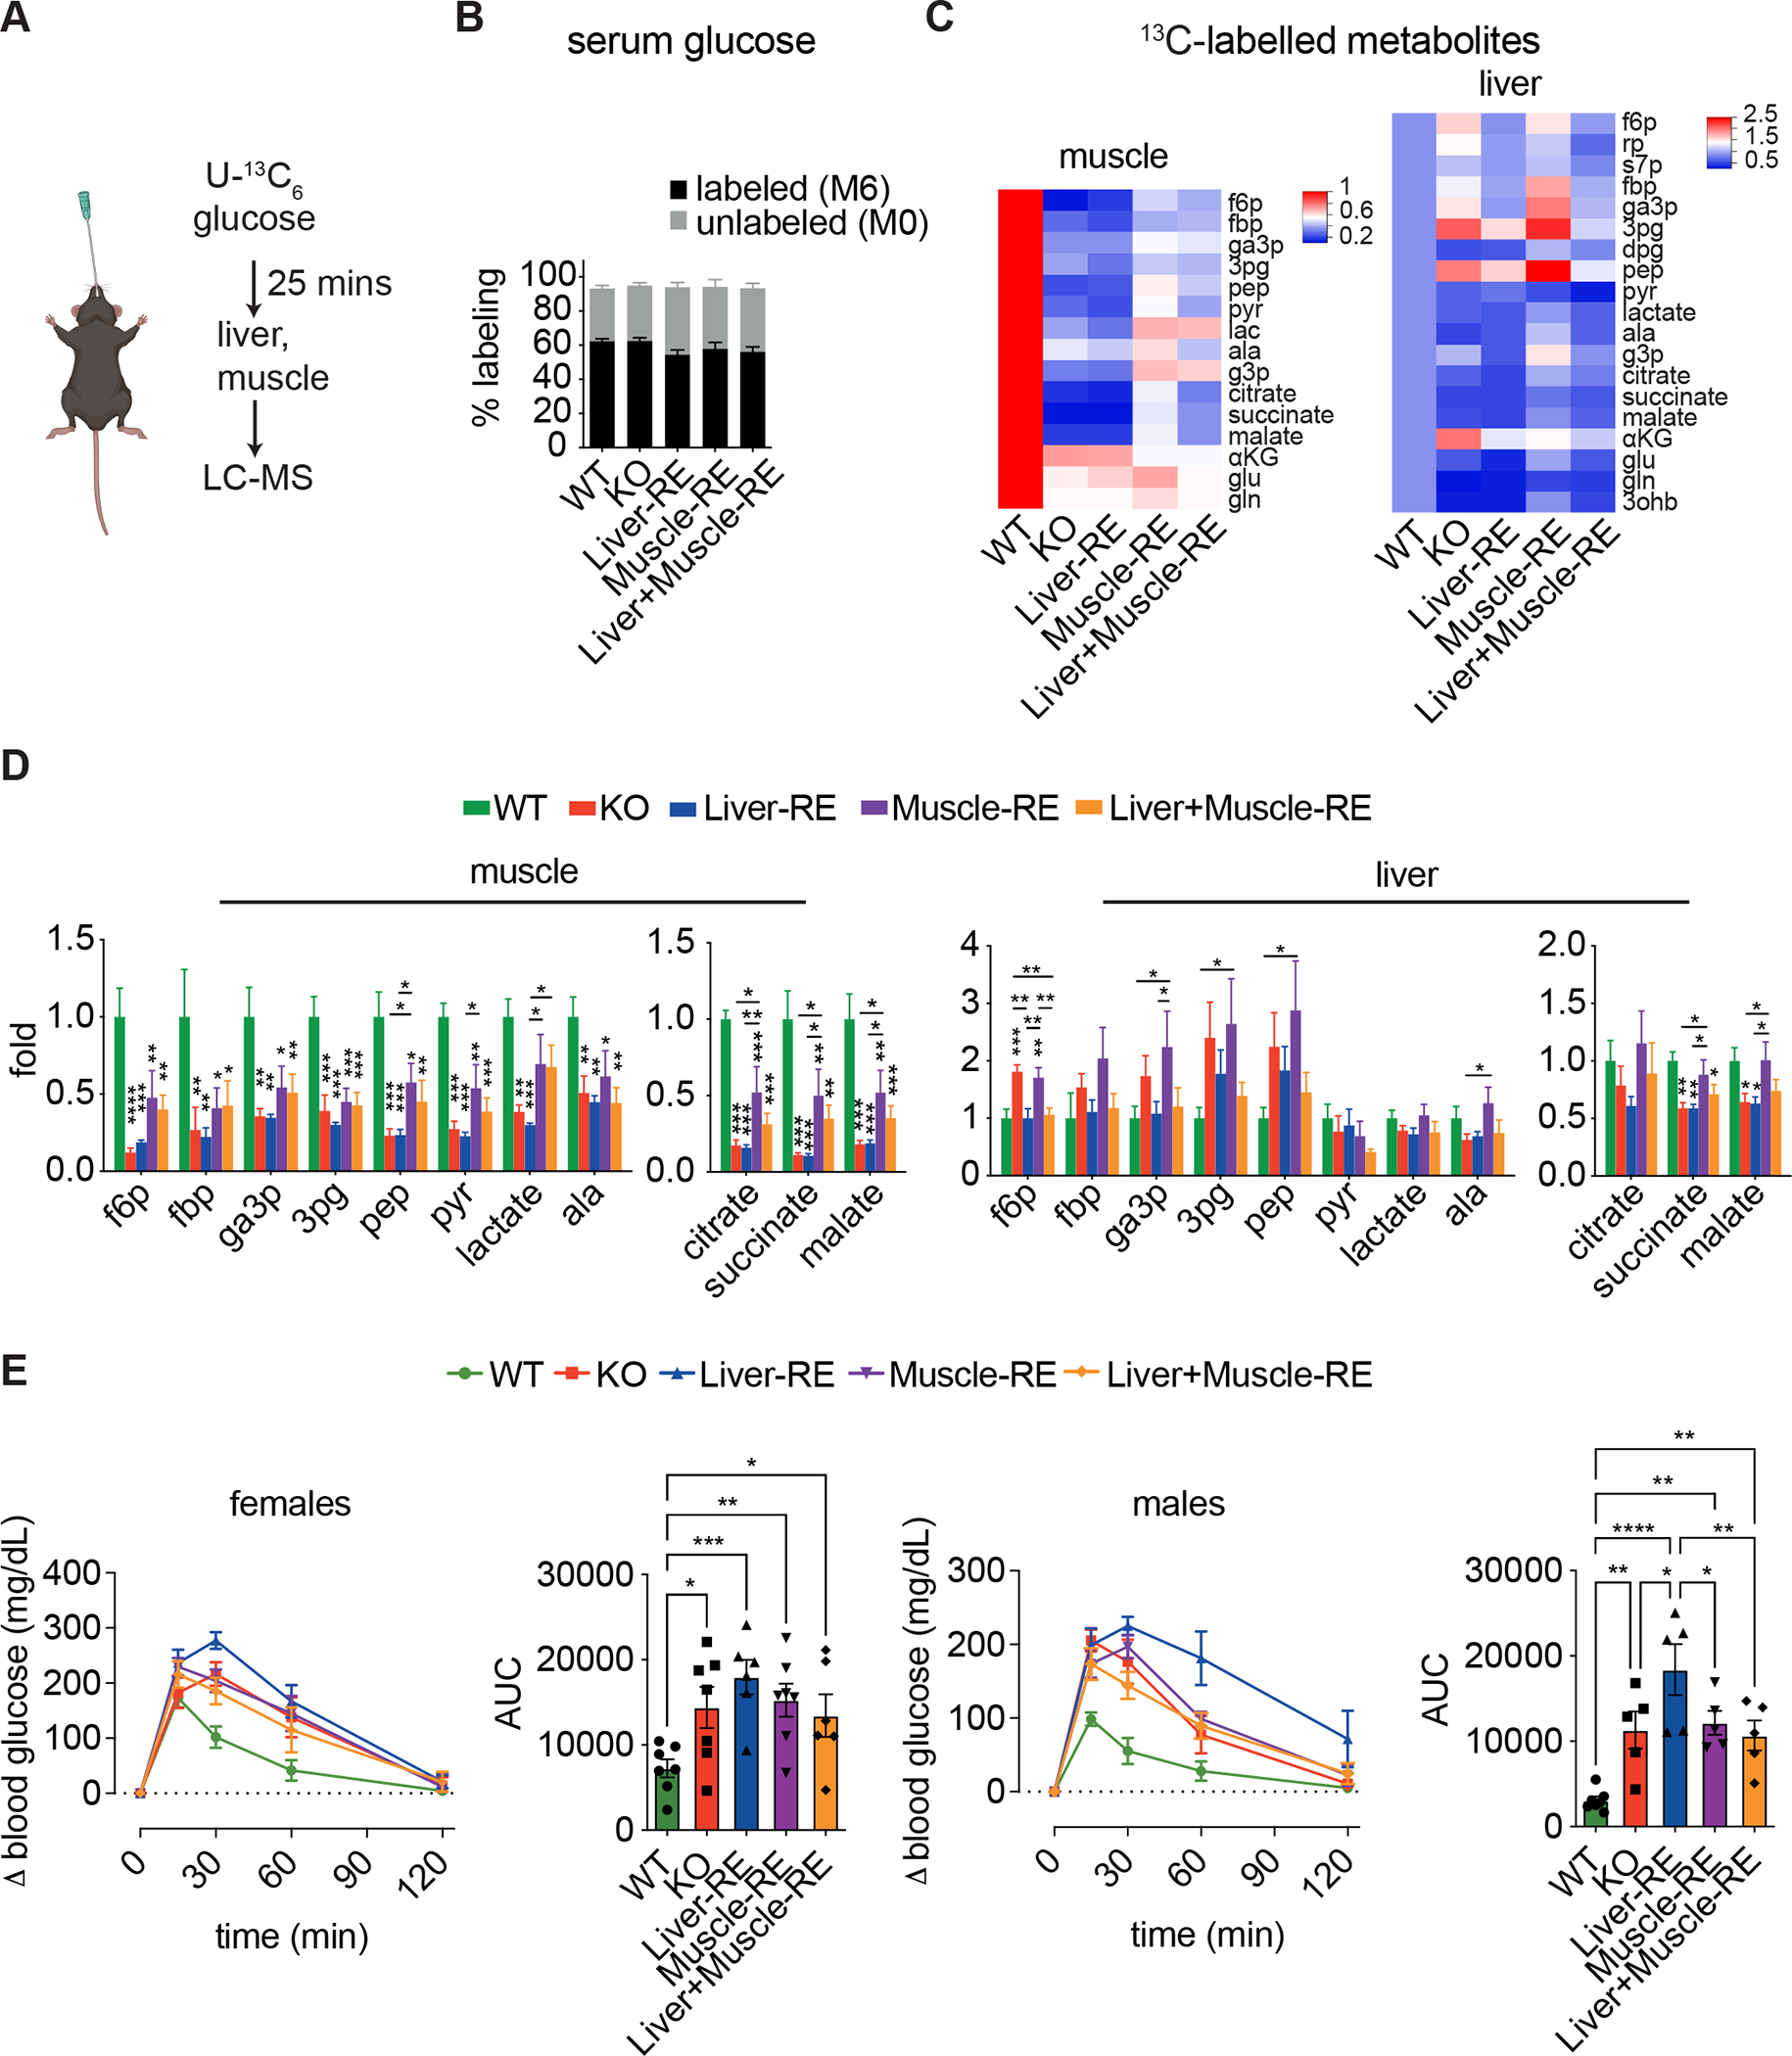
(A) Experimental design of isotope tracing, n = 5–6 (WT-Alfp-Cre = 2; WT-Hsa-Cre = 2; WT-Alfp+Hsa-Cre = 2). Data are 13C-labeled ion counts relative to WT.
(B) Labeling of circulating glucose.
(C) Heatmaps of downstream 13C metabolites. 3ohb, 3-hydroxybutyrate; 3pg, 3-phosphoglycerate; aKG, alpha-ketoglutarate; ala, alanine; dpg, 2,3 diphosphoglycerate; f6p, fructose 6-phosphate; fbp, fructose 1,6-bisphosphate; g3p, glycerol 3-phosphate; ga3p, glyceraldehyde 3-phosphate; glu, glutamate; gln, glutamine; lac, lactate; pep, phosphoenolpyruvate; pyr, pyruvate; rp, ribose phosphate; s7p, sedoheptulose 7-phosphate.
(D) Labelling of glycolysis and TCA cycle metabolites. One-way ANOVA, Fisher’s LSD post-hoc test, *p < 0.05, **p < 0.01, ***p < 0.001, ****p < 0.0001.
(E) Oral glucose tolerance tests in female (left, n=6–7) and male (right, n=5–7) mice. WTs = WT-Alfp+Hsa-Cre. Bar graph area under the curve (AUC) – one-way ANOVA, Fisher’s LSD post-hoc test, *p < 0.05, **p < 0.01, ***p < 0.001, ns = not significant.
Data are presented as mean ± SEM. See also Figure S5. Figure 5A created using Biorender.com.