
Figure 6. Feeding rhythms and autonomous clocks bolster time-dependent gene expression in liver and muscle.
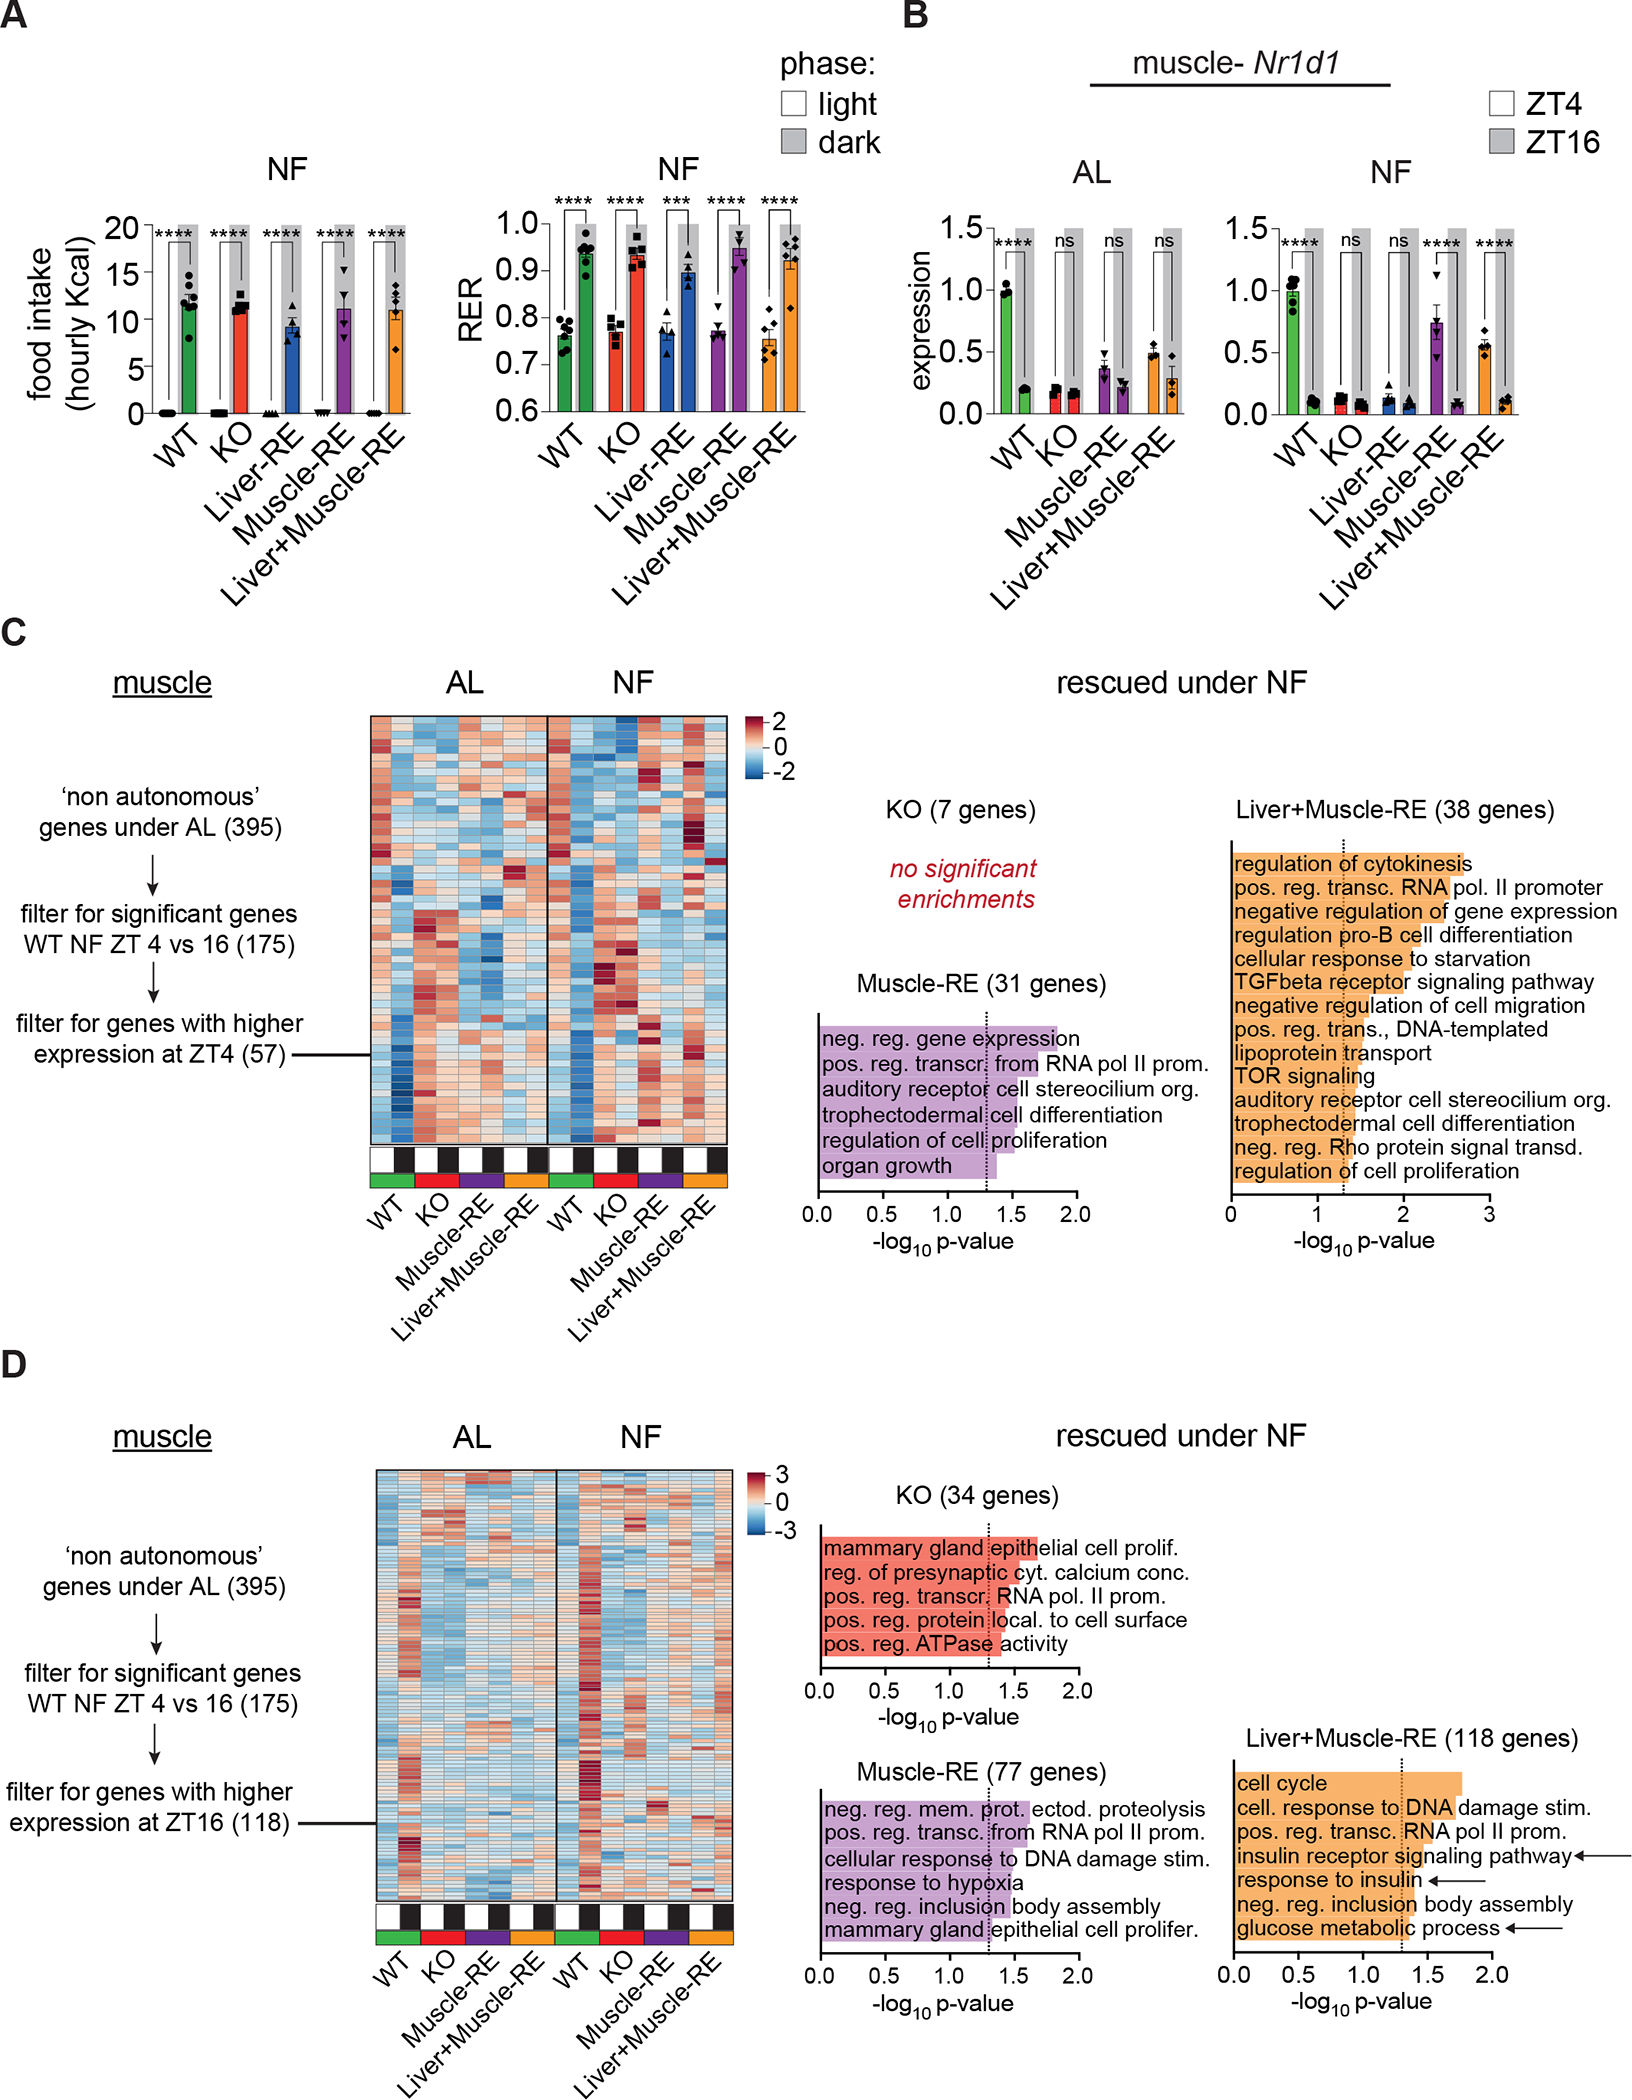
(A) Left, light vs dark phase food intake under night feeding (NF) conditions. n = 4–7 (WT-Alfp-Cre = 2; WT-Hsa-Cre = 1; WT-Alfp+Hsa-Cre = 4). Two-way ANOVA, Bonferroni’s post-hoc test, ****p < 0.0001. Right, average light and dark phase respiratory exchange ratio (RER), n = 5–7 (WT-Alfp-Cre = 2; WT-Hsa-Cre = 1; WT-Alfp+Hsa-Cre = 4). Two-way ANOVA, Bonferroni’s post-hoc test, ***p < 0.001.
(B) RNA-seq data from ad libitum (AL) and NF mice at ZT4 and ZT16, n = 3–6. For NF, WT-Alfp-Cre = 2; WT-Hsa-Cre = 2; WT-Alfp+Hsa-Cre = 2. Two-way ANOVA, Bonferroni’s post-hoc test, **p < 0.01, ****p < 0.0001. ns – not significant.
(C and D) Left, heatmaps of AL non-autonomously oscillating genes peaking at ZT4 (C) or ZT16 (D), DEseq2 FDR <0.05. Right, DAVID biological process enrichment for genes not significantly different vs WT at either time point (i.e., rescued by NF) (DE-seq2 FDR <0.05), some pathway names abbreviated. Arrows = glucose related pathways.
Data are presented as mean ± SEM. See also Figures S6–12.