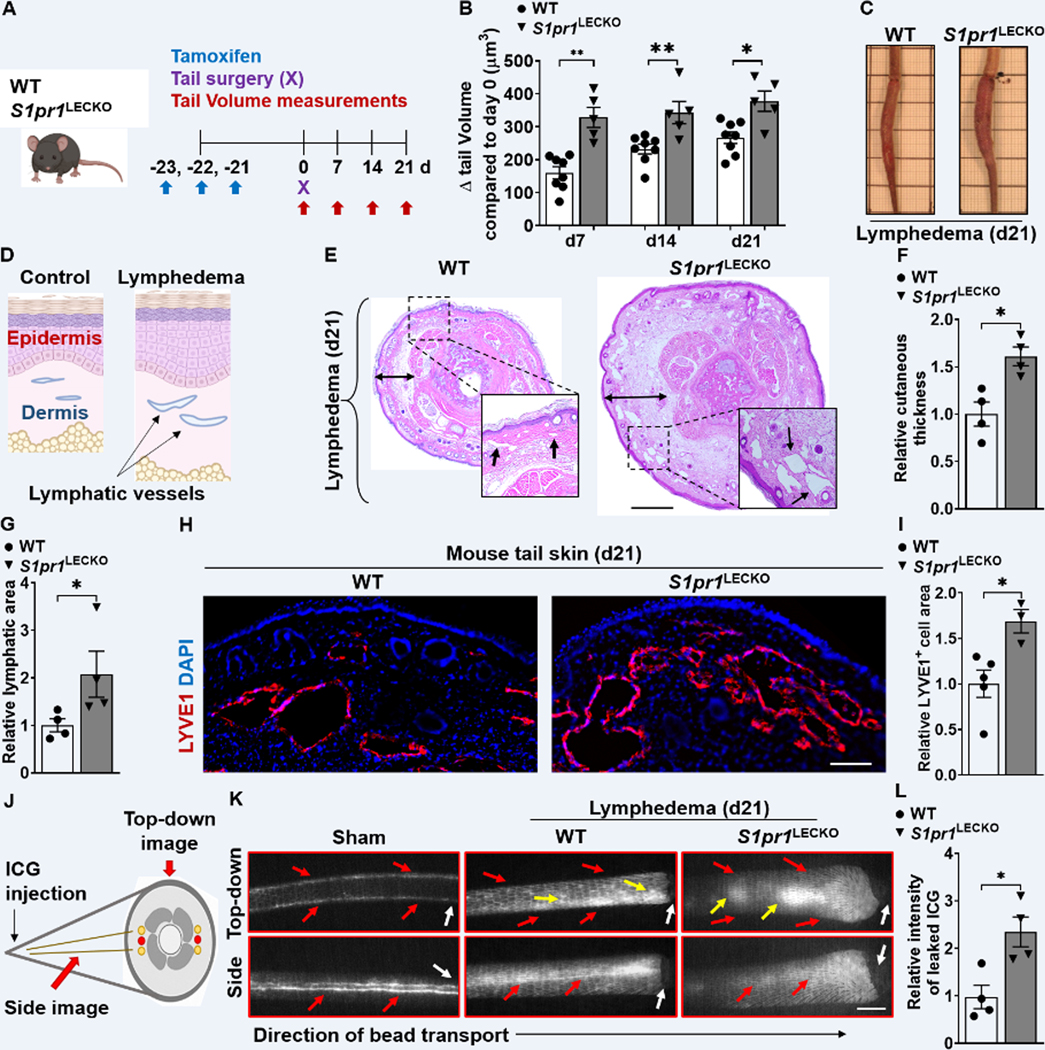
Figure 2. LEC-specific S1pr1 deficiency exaggerates tissue swelling, augments cutaneous skin thickness, promotes lymphatic leakage, and reduces lymphatic drainage.

(A) Schematic diagram of the experimental protocol. (B) Quantification of tail volume changes over time of WT and S1pr1LECKO mice after lymphatic surgery (n ≥ 5 per each group). (C) Representative photographs of tails 21d following lymphatic surgery. (D) A cartoon showing the cross-section view of mouse-tail skin with or without lymphedema. (E toG) H&E staining of tail cross-section 21d following lymphatic surgery. Representative images (E) are shown. Black arrows indicate lymphatic vessel areas. Double-headed black arrows demonstrate cutaneous thickness. Quantification of cutaneous thickness (F) and lymphatic vessel luminal areas (G) are shown (n = 4 per each group). Scale bar = 1 mm. (H and I) Immunofluorescent images of LYVE1 (red) of tail skin 21d after surgery. Representative image (H) and quantification of the LYVE1 area data (I) are shown (n ≥ 3 per each group). DAPI (blue) stains the nucleus. Scale bar = 100 μm. (J) A cartoon showing one side of the mouse tail with two-line lymphatic trunks. (K and L) Near-infrared imaging 21d following lymphatic surgery after ICG injection near the tip of the tail. Representative images (K) are shown. White arrows denote surgical sites. Red arrows indicate ICG drainage. Yellow arrows indicate ICG leakage. Scale bar = 0.5 cm. Quantification of leakage (L) is shown (n = 4 per each group). Data are presented as the mean ± SEM; * p < 0.05 and ** p < 0.01 by the Mann-Whitney test. ICG; indocyanine green.
