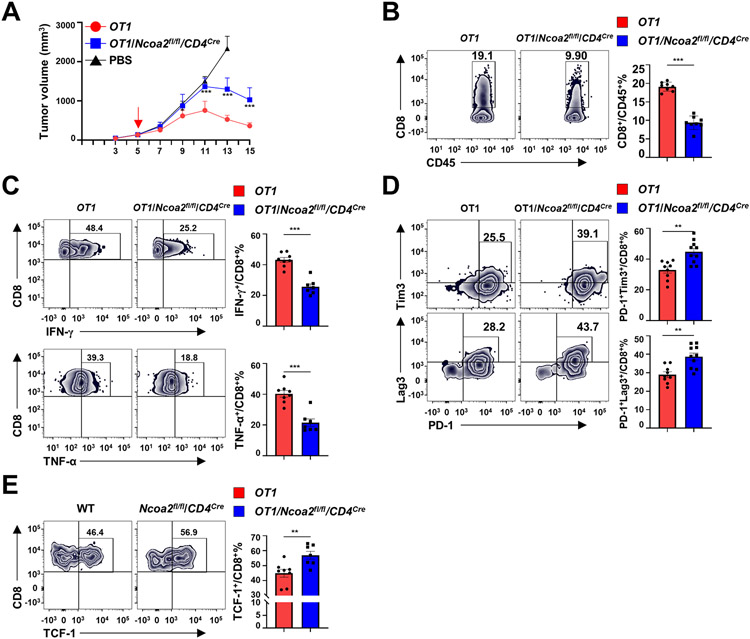
Figure 2. Ncoa2 is essential for CD8+ T cell-mediated tumor rejection.
(A) Quantification of tumor volume in Rag1−/− recipient mice implanted with 5 x 10⁵ MC38-Ova cancer cells and then adoptively transferred with PBS (n=4) or indicated CD8+ (5 x 10⁵) and WT CD4+ (5 x 10⁵) naïve T cells at day 5 post-engraftment (n=8; 3 independent experiments). (B-F) Representative flow cytometric analysis (left panels) and percentage of CD8+/CD45+ lymphocytes (B), IFN-γ+/CD8+ (C, top panels), TNF-α+/CD8+ (C, bottom panels), PD-1+Tim3+/CD8+ (D, top panels), PD-1+Lag3+/CD8+ (D, bottom panels), TCF1+/CD8+ (E) cells in tumors from Rag1−/− mice shown in (A) on day 15 post-engraftment. Data are shown as mean ± SEM. **P<0.01; ***P<0.001 (two-tailed unpaired Student’s t-test).

