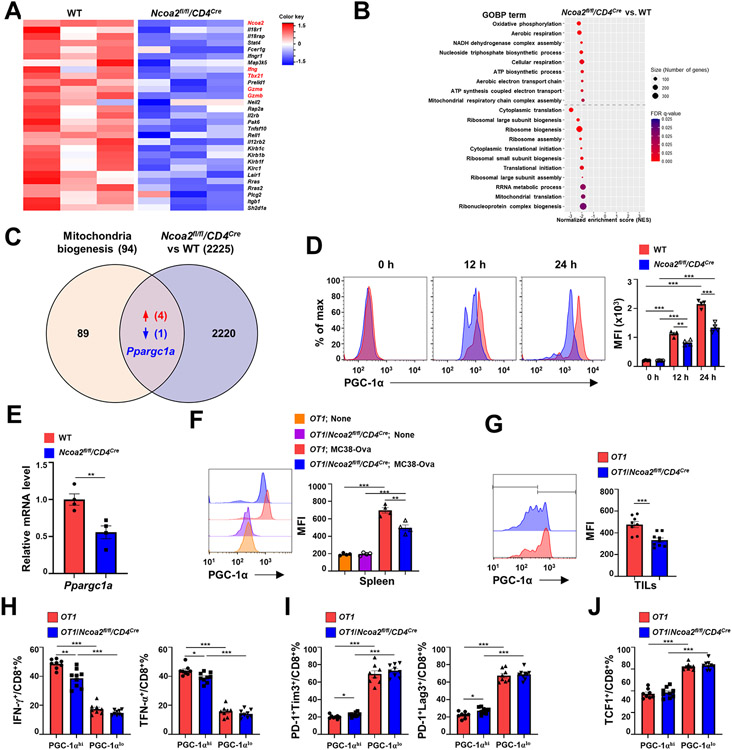
Figure 4. Ncoa2 is required for the upregulation of PGC-1α critical for mitochondrial function.
(A-B) Computational analysis of RNA sequencing (RNA-seq) data of CD8+ T cells sorted from the spleen of OT1 and OT1/Ncoa2fl/fl/CD4Cre mice that were challenged with MC38-Ova cancer cells for 3 days (n=3). (A) Heatmap of CD8 T cell activation-related genes. (B) Gene set enrichment analysis (GSEA) plots of DEGs involved in dysregulated mitochondrial metabolism in Ncoa2fl/fl/CD4Cre CD8+ T cells. (C) Venn diagram of gene overlapping between 94 mitochondrial biogenesis-function-related genes (Reactome database) and 2225 DEGs (including additional genes with fc>2 or fc<−2 in addition to 860 DEGs). (D) Representative flow cytometric analysis (left panels) and mean fluorescent intensity (MFI, right panel) of PGC-1α in CD8+ T cells stimulated by α-CD3/CD28 antibodies for 0, 12, and 24 h. (E) RT-qPCR analysis of PGC-1α mRNA level in indicated CD8+ T cells stimulated by α-CD3/CD28 antibodies for 24 h (n=4). (F-G) Representative flow cytometric analysis (left panels) and MFI of PGC-1α in CD8+ T cells from the spleen (F, n=4) or tumor infiltrated CD8+ T cells (G, n=8-9) of indicated OT1 mice at day 3 (F) or 14 (G) post-challenge with MC38-Ova cells. (H-J) Percentages of IFN-γ+ and TNF-α+ (H), PD-1+Tim3+ and PD-1+Lag3+ (I), and TCF1+ (J) CD8+ T cells in PGC-1αhi or PGC-1αlo populations shown in G. MFI: mean fluorescence intensity. (D-H) Data shown are mean ± SEM. *P<0.05; **P<0.01; ***P<0.001; ns, not significant (two-tailed unpaired Student’s t-test).

