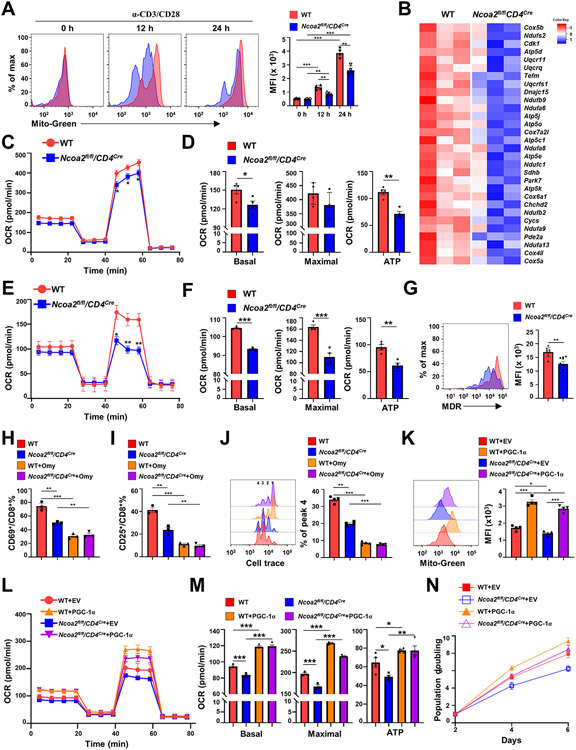
Figure 6. CD8+ T cells deficient in Ncoa2 display defective mitochondrial function.
(A) Representative flow cytometric analysis (left panels) and mean fluorescence intensity (MFI) (right panels) of the mitochondrial mass by MitoTracker Green (Mito-Green) of indicated CD8+ T cells activated in vitro for 0, 12, and 24 h (n=4). (B) Expression heatmap of genes regulating oxidative phosphorylation in indicated CD8+ T cells. Negative Z-score indicates downregulation. (C-F) Seahorse analysis of oxygen consumption rate (OCR) detected over 80 minutes in CD8+ T cells activated in vitro (C and D, n=6-7) or activated in vivo from tumor-infiltrated lymphocytes (E and F, n=8-9). Bar graphs show basal or maximal OCR, and ATP production (D and F). (G) Representative flow cytometric analysis (left panels) and MFI of mitochondrial member potential by MitoTracker Deep Red (MDR) in indicated CD8+ T cells activated in vitro (n=8-9). (H-I) The percentage of CD69+ (H) or CD25+(I) among indicated CD8+ cells in vitro activated in the absence or presence of oligomycin (Omy). (J) Proliferation detected by Cell Trace dye (quantification was done to peak 4) of indicated CD8+ T cells activated by plate α-CD3/28. (K) Representative flow cytometric analysis (merged, left panels) and MFI (right panels) of the mitochondrial mass by Mito-Green of indicated CD8+ T cells retrovirally expressing GFP alone (EV, empty virus) or with PGC-1α and activated in vitro (n=4). (L-M) Seahorse analysis of mitochondrial OCR detected over 80-minutes (L, n=5-6) of indicated CD8+ T cells retrovirally expressing GFP alone (EV) or with PGC-1α and activated in vitro. (M) The basal (left panel), maximal (middle panel) OCR and ATP production calculated from L. (N) Doubling of cell number over 6 days post-in vitro stimulation of indicated CD8+ T cells retrovirally expressing GFP alone (EV) or with PGC-1α. Data shown are mean ± SEM. *P<0.05; **P<0.01; ***P<0.001 (two-tailed unpaired Student’s t-test).

