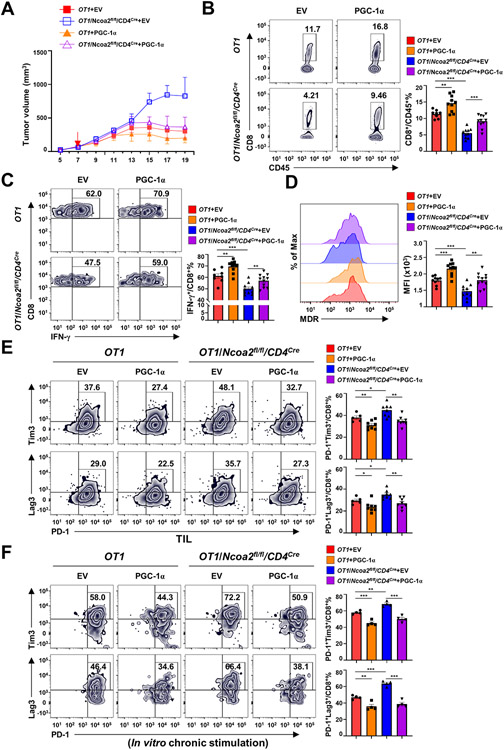
Figure 7. Forced expression of PGC-1α restores Ncoa2fl/fl/CD4Cre CD8+ T cell-mediated anti-tumor immunity.
(A) Quantification of the volume of tumors in Rag1−/− mice implanted with 5 x 10⁵ MC38-Ova cancer cells and then adoptively transferred with indicated CD8+ (5 x 10⁵) expressing GFP alone (EV) or with PGC-1α for 7 days (n=8-11; 2 independent experiments). (B-E) Representative flow cytometric analysis (left panels) and percentage (B, C, E, and F) or MFI (C) of CD8+/CD45+ cells (B), IFN-γ+/CD8+ cells (C), mitochondrial membrane potential by MDR (D), and PD-1+Tim3+/CD8+ cells (E, top panels) and PD-1+Lag3+/CD8+ cell (E, bottom panels) percentage (E) in tumor infiltrated lymphocytes 19 days post tumor implantation shown in (A). (F) Representative flow cytometric analysis (left panel) and percentage of PD-1+Tim3+/CD8+ (top panels) and PD-1+Lag3+/CD8+ (bottom panels) cells retrovirally expressing GFP alone (EV) or with PGC-1α and chronically activated with plate-bound α-CD3 antibody for 8 days. (B-F) Data are shown as mean ± SEM. *P<0.05; **P<0.01; ***P<0.001 (two-tailed unpaired Student’s t-test).

