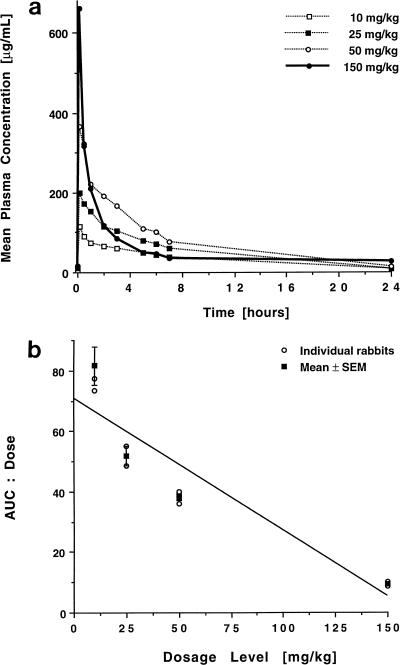
FIG. 2.
Multiple-dose plasma pharmacokinetics of BMS 181184. (a) Concentration-versus-time curves after administration of 10, 25, 50, and 150 mg of the compound/kg over 15 days. Each point plots the mean level for three rabbits each at that time. (b) Plot of the ratios of AUC0–24/dose for each rabbit and the mean ± the standard error of the mean (SEM) for each dosage group. Similar to the single-dose data, the significantly negative slope of the means (P < 0.005; ANOVA) demonstrates the nonlinear kinetics of BMS 181184 after multiple dosing.

