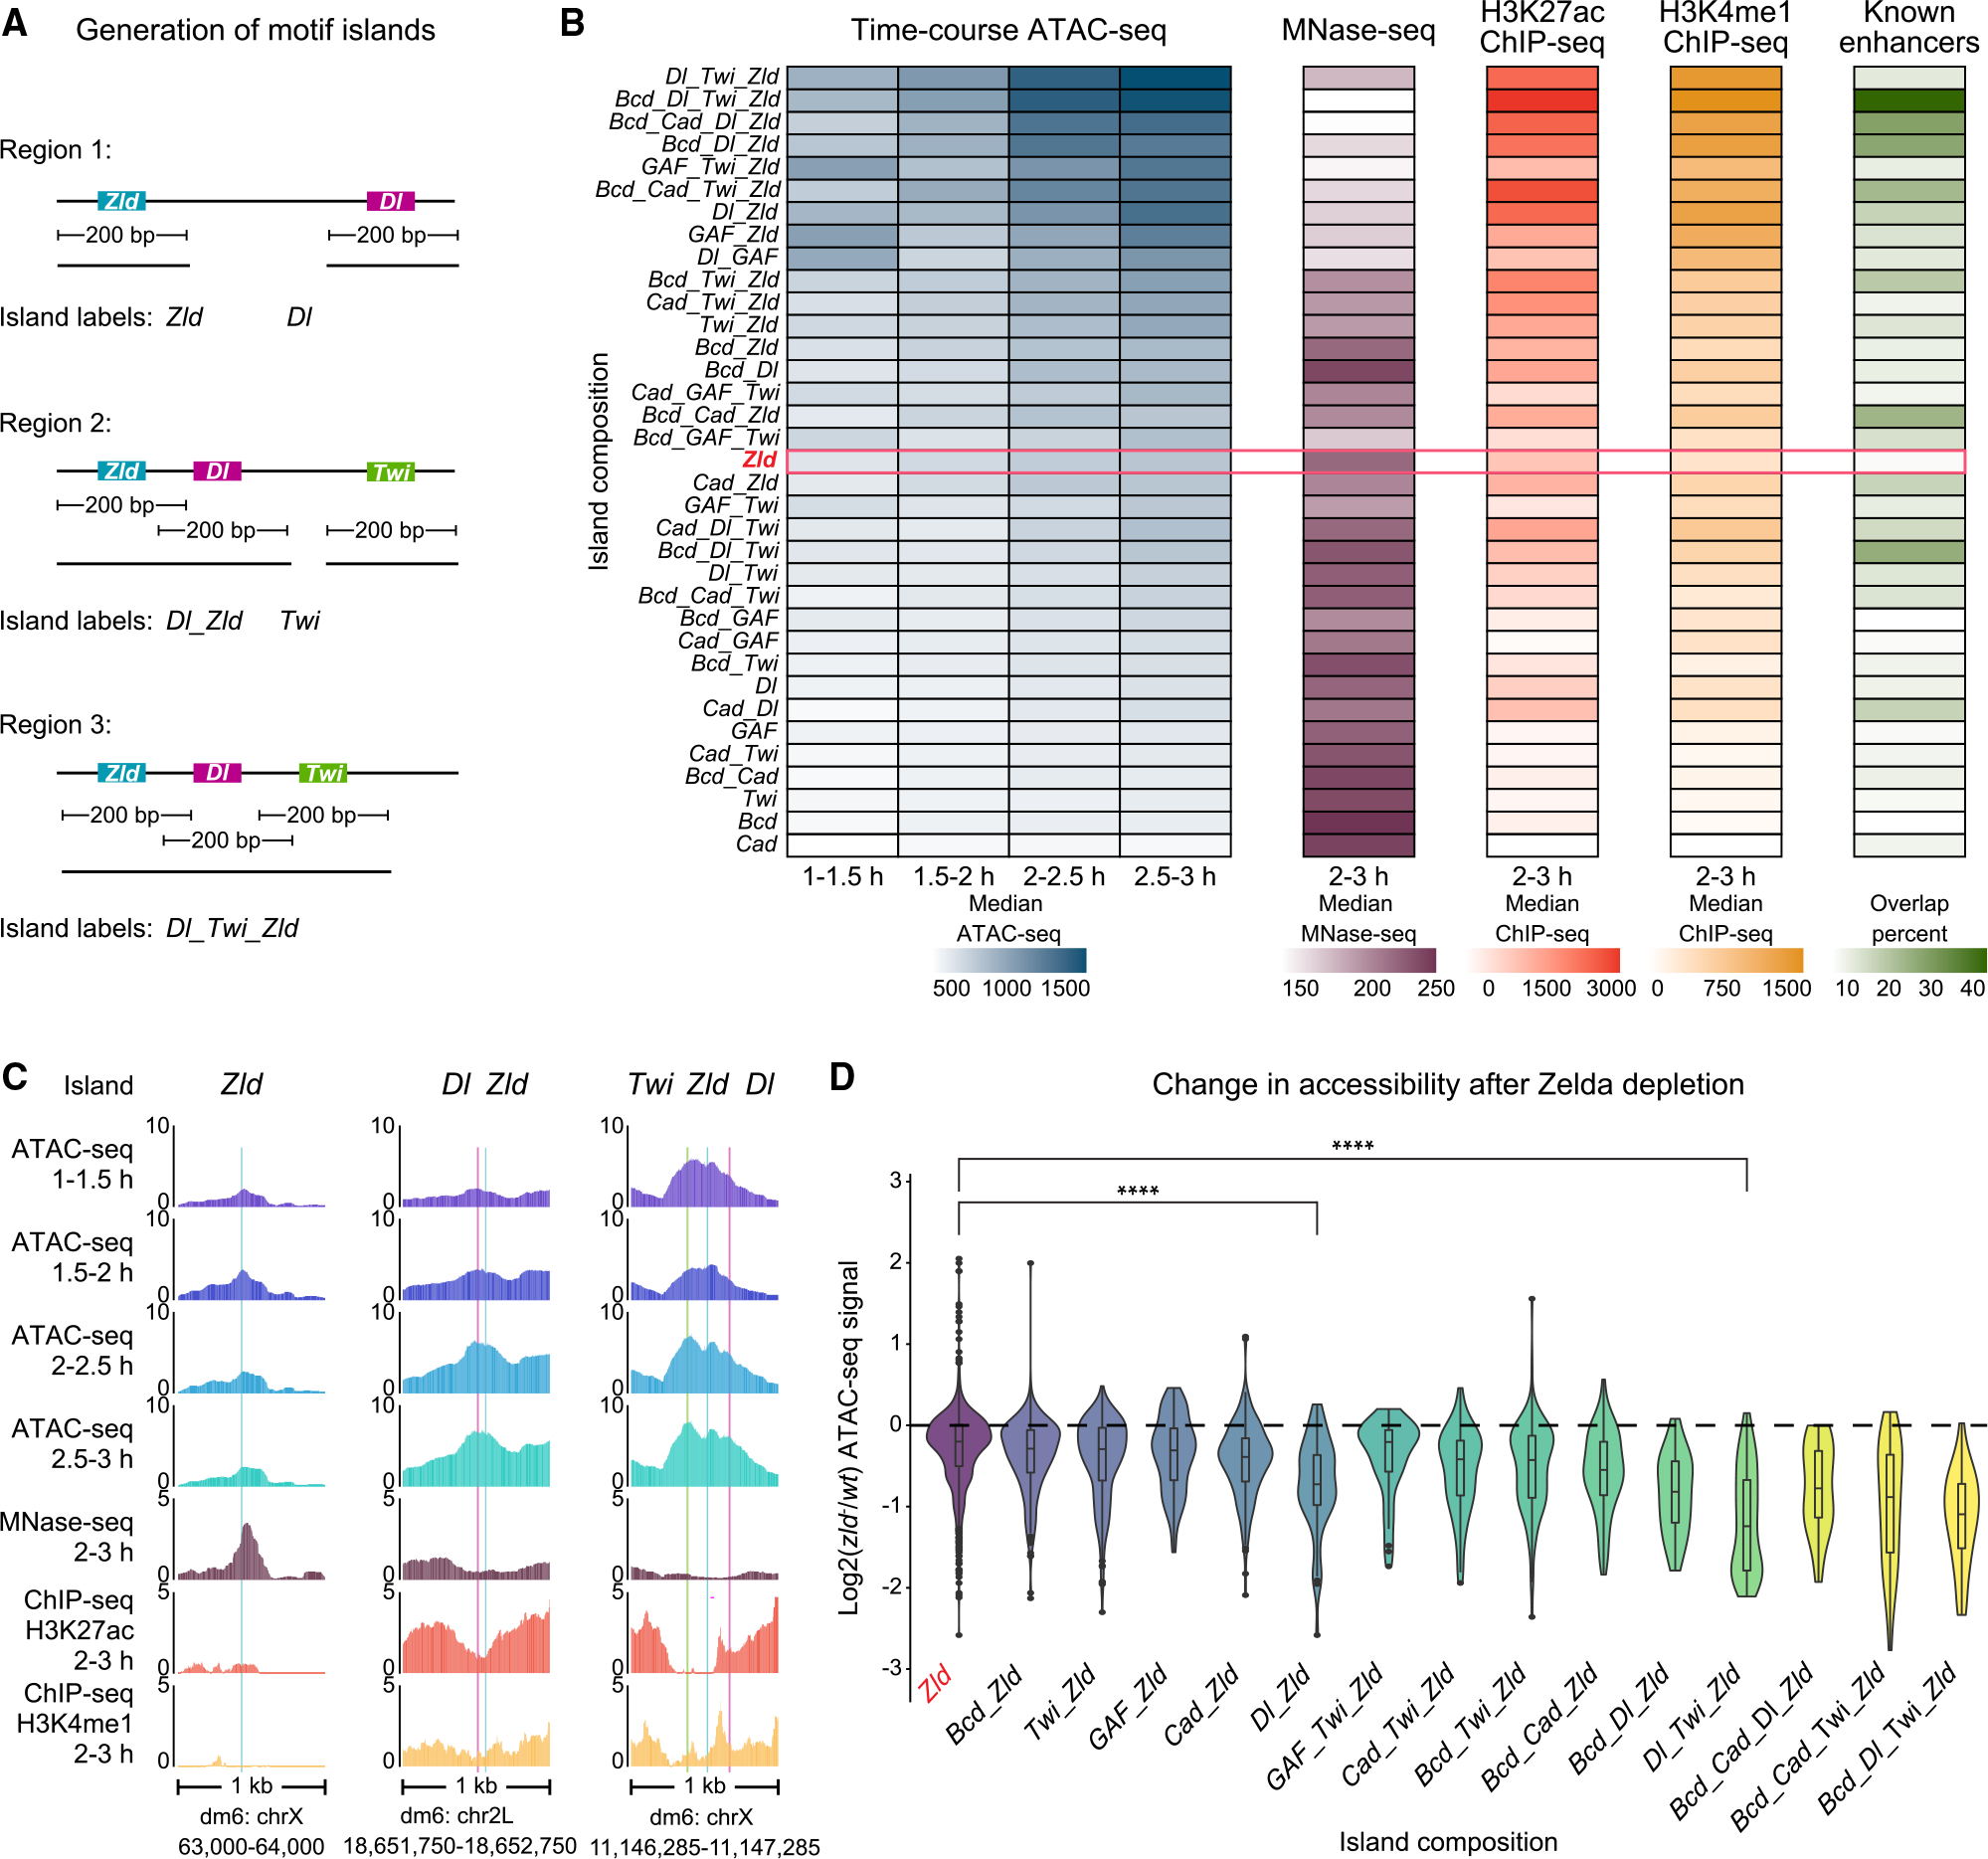
Figure 4. Patterning TFs increase chromatin accessibility in a context-dependent manner.

(A) Schematic summary of motif islands. Motif islands are generated by first resizing all BPNet-mapped and bound motifs to 200 bp wide. Next, overlapping regions are merged and classified based on the motifs that compose them. See also Table S1.
(B) Islands with combinations of Zelda and patterning TF motifs contain the highest chromatin accessibility, nucleosome depletion, active enhancer histone modifications, and known enhancer overlap. For each motif island type with a specific motif composition (y axis), the median normalized ATAC-seq fragment coverage, MNase-seq signal, H3K27ac ChIP-seq signal, H3K4me1 ChIP-seq signal and the overlap with enhancers active in 2–4 h AEL74 embryos are shown via the color scale. The red bar highlights islands that contain only Zelda motifs, and islands are ordered by total ATAC-seq signal. See also Figures S1D–S1E and S5F.
(C) Individual island examples, where colored bars indicate BPNet-mapped motifs (blue = Zld, magenta = Dl, green = Twi).
(D) Chromatin accessibility is most strongly reduced in zld− embryos at islands containing Zelda and patterning TF motifs. Using DESeq2, log2-fold changes in ATAC-seq signal between wt and zld− embryos were calculated for each island, and their median changes across the time points are shown. Islands that contain patterning TF motifs in addition to Zelda motifs show significantly more changes than those with Zelda motifs only, e.g., the difference between Zld and Dl_Zld islands (p = 8.3e−11, Wilcoxon rank-sum test) and Zld and Dl_Twi_Zld islands (p < 2.22e−16, Wilcoxon rank-sum test).
