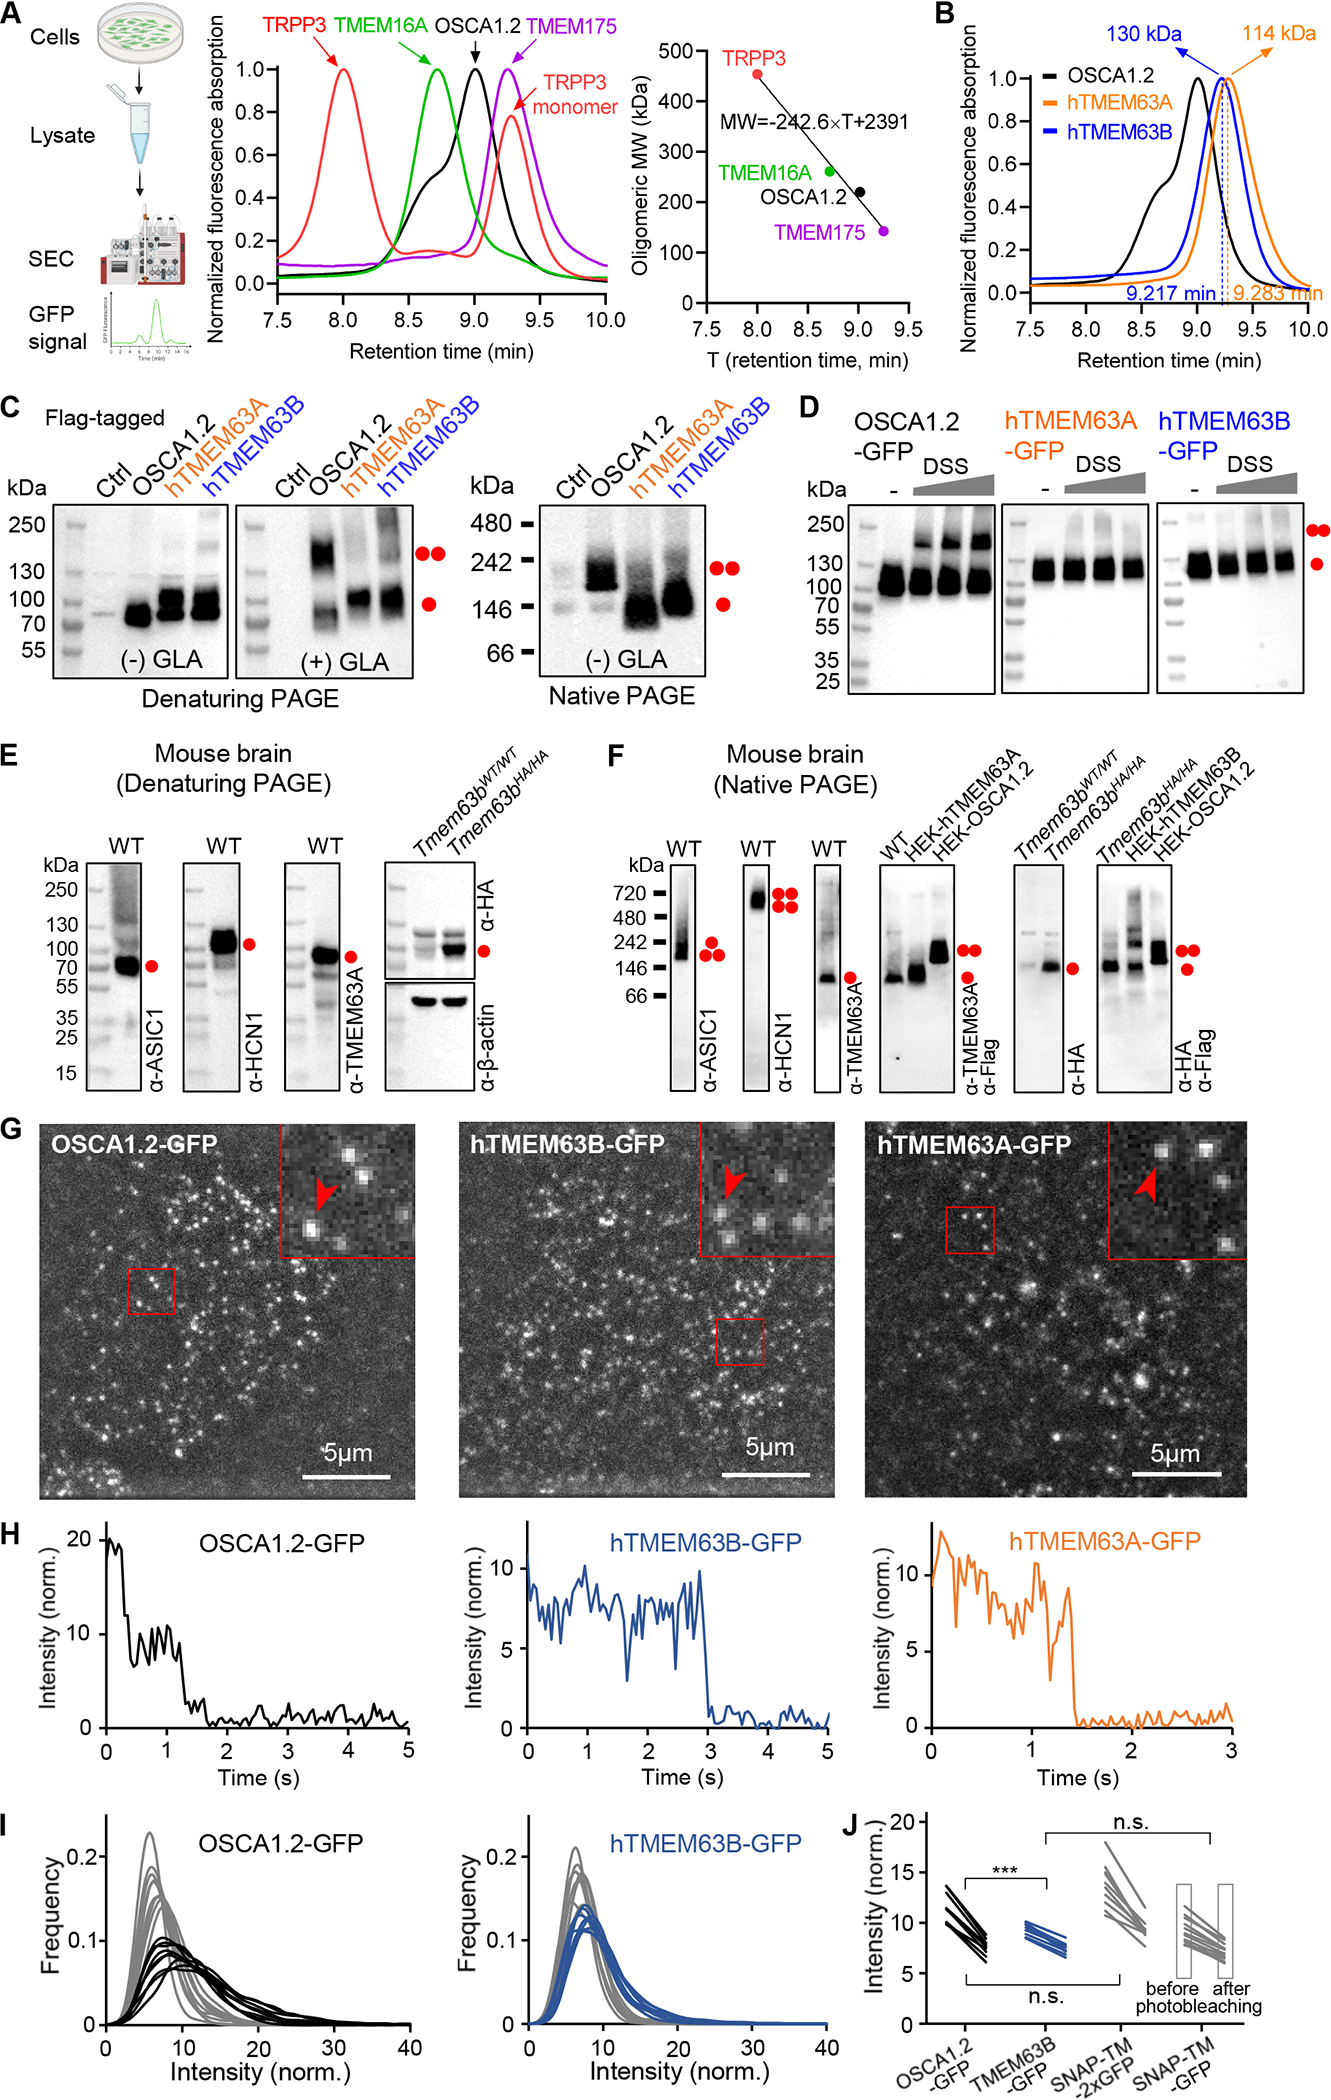
Figure 1. TMEM63A and TMEM63B exist as monomers.

(A) Left, schematic diagram of FSEC; middle, normalized FSEC traces of GFP-tagged membrane proteins; right, oligomeric MW (with GFP) versus retention time fit deduced from middle panel data.
(B) Normalized FSEC traces of OSCA1.2, human TMEM63A and TMEM63B. Calculated oligomeric MWs (without GFP) are shown.
(C) Representative denaturing and blue native PAGE of HEK293T cell lysates without (Ctrl) or with indicated protein overexpression. The cell lysate was treated without (−) or with (+) 10 mM glutaraldehyde (GLA). Monomeric and dimeric protein bands are indicated.
(D) Representative western blots of HEK293T cell lysates with overexpression of GFP-tagged proteins. Cells were treated without or with membrane permeable disuccinimidyl suberate (DSS) (in mM: 0.0312, 0.0625, 0.125) before lysate preparation.
(E) Representative denaturing PAGEs of whole brain tissue of Tmem63bWT/WT (WT) or Tmem63bHA/HA knock-in mice.
(F) Representative blue native PAGEs of membrane fraction of mouse brain tissues. HEK293T cell lysates with overexpression of Flag-tagged proteins were also included.
(G) Single-molecule images from the first frames of CHO cells expressing OSCA1.2-GFP, hTMEM63B-GFP and hTMEM63A-GFP.
(H) Intensity time courses of marked spots from panel G.
(I) Intensity distribution before (black, blue) and after (gray) photobleaching for OSCA1.2-GFP and hTMEM63B-GFP.
(J) Mean intensity values before and after photobleaching for OSCA1.2-GFP, hTMEM63B-GFP and the control proteins containing one or two GFP tags.
See also Figure S1.
