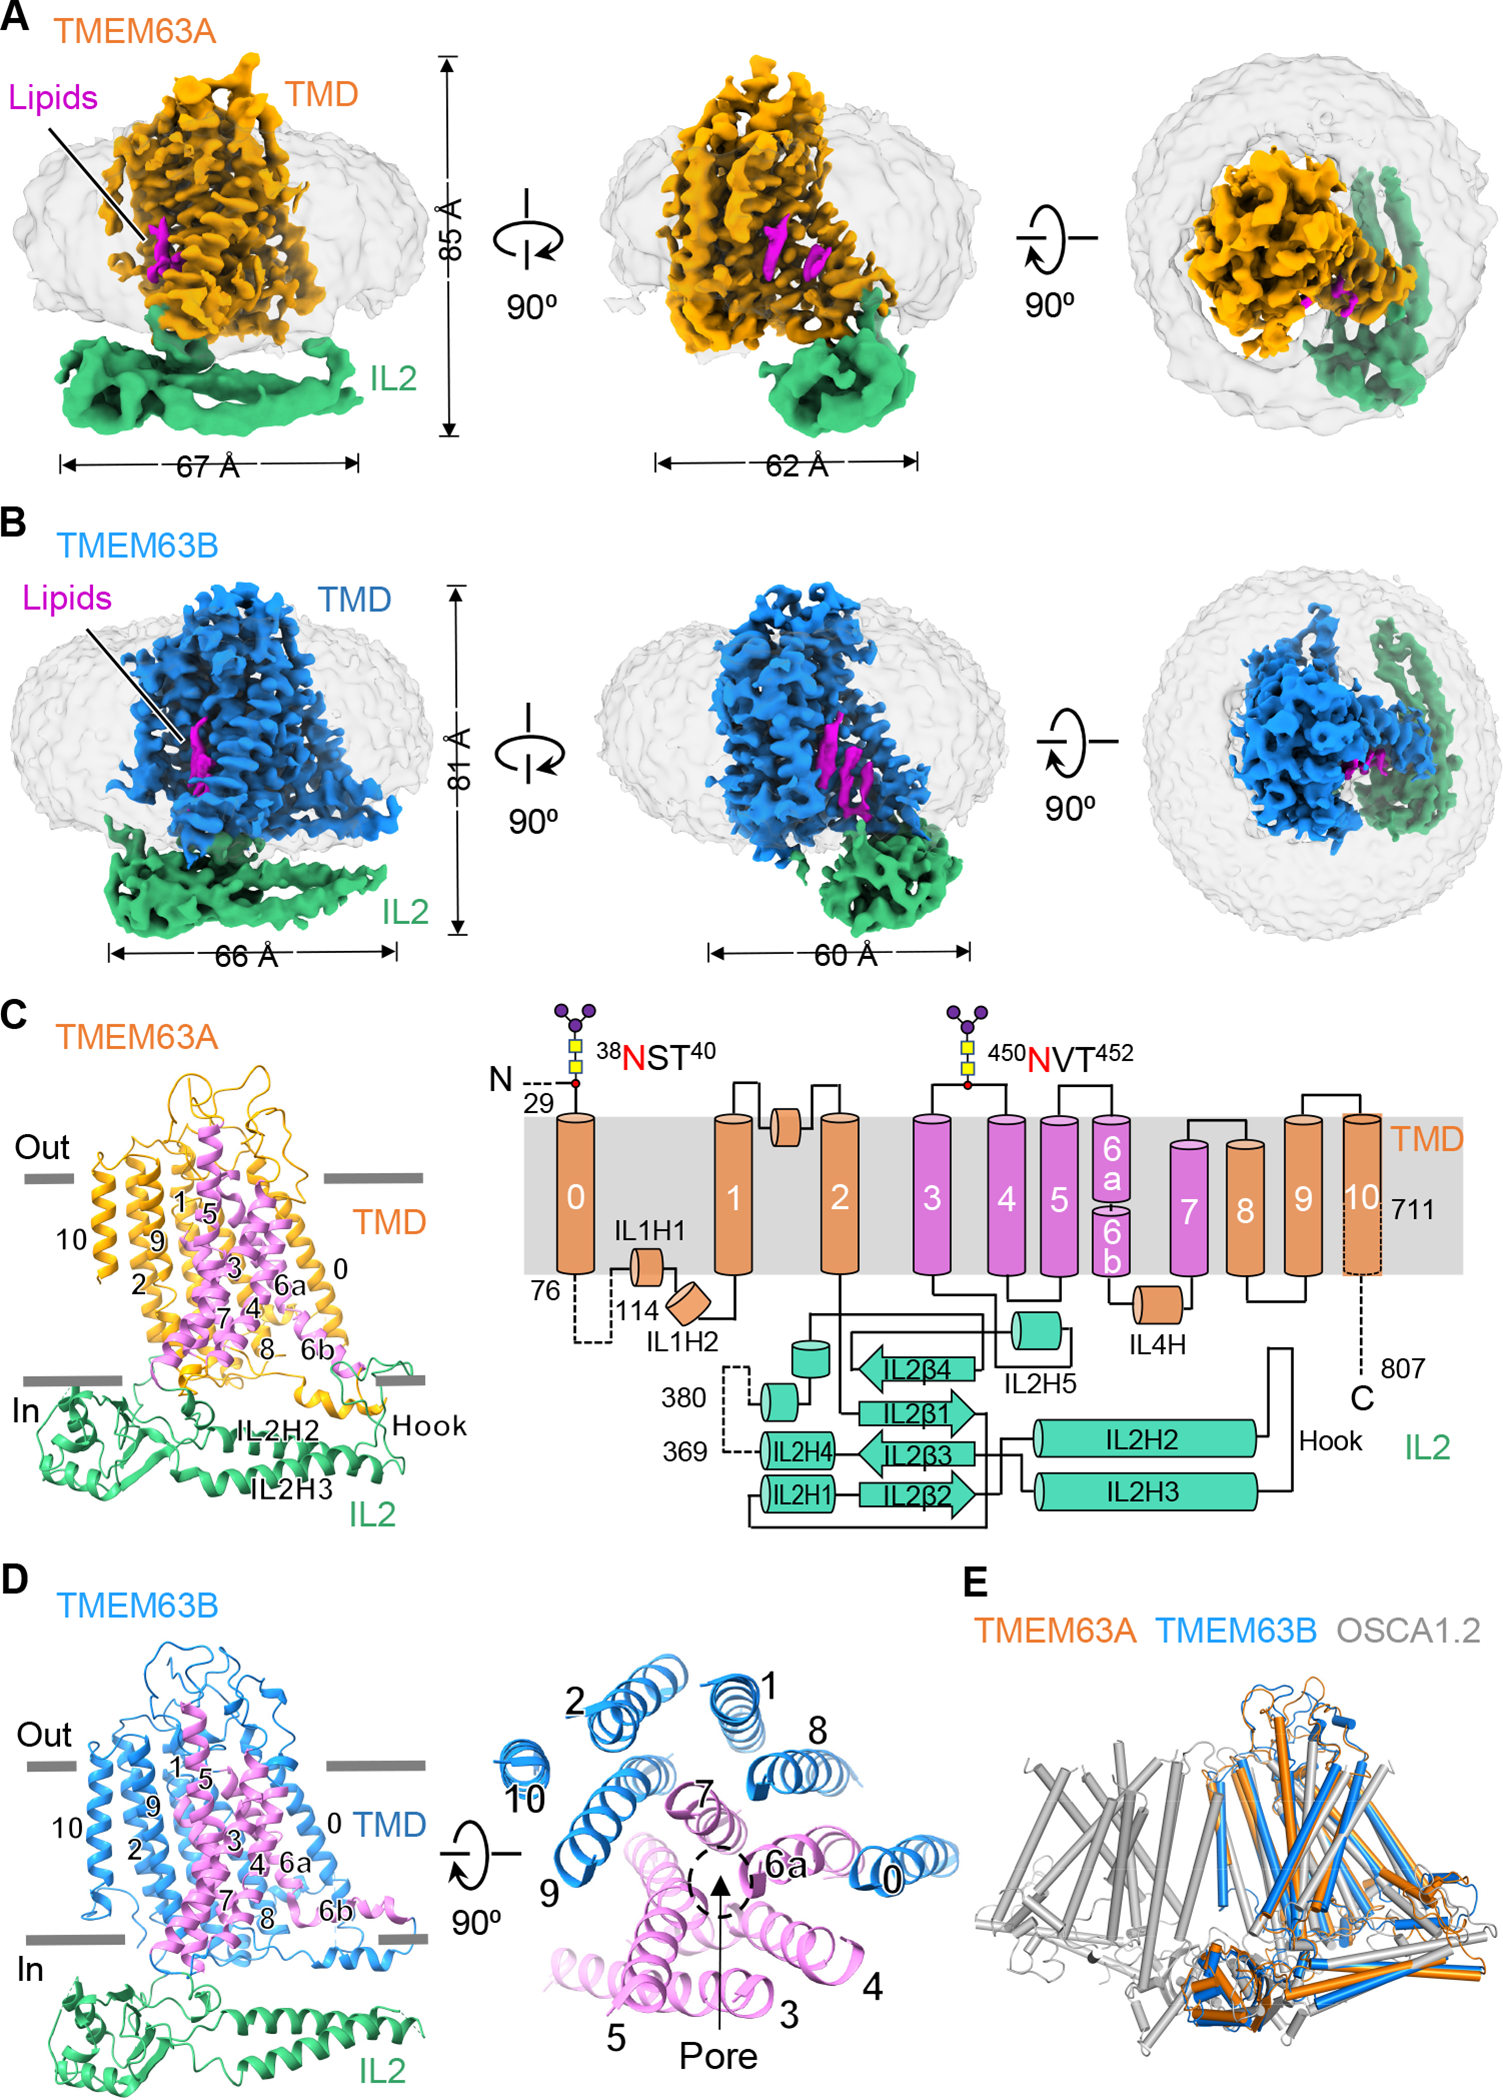
Figure 2. Cryo-EM structures of human TMEM63A and TMEM63B.

(A and B) Side and top views of EM density maps of TMEM63A in nanodisc (A) and TMEM63B in detergent LMNG (B). Densities for the transmembrane domain (TMD) are colored in either orange (TMEM63A) or blue (TMEM63B). Densities of intracellular linker 2 (IL2) are colored green. Densities of nanodisc and detergent are grey. Lipid densities are highlighted in magenta.
(C) Left, side view of TMEM63A in ribbon representation, with the pore-lining helices (TM3-TM7) colored in magenta. Right, topology diagram of TMEM63A with major structural components highlighted. Dashed lines denote regions excluded in model building due to missing density. Two N-linked glycosylation sites were predicted based on the protruding densities near N38 and N450 (Figure S4).
(D) Left, side view of TMEM63B with the pore-lining helices (TM3-TM7) colored in magenta. Right, top view of the TM segments of TMEM63B with the location of the pore indicated.
(E) Structural alignments of monomeric human TMEM63A and TMEM63B with one subunit of dimeric OSCA1.2 (PDB: 6MGV).
