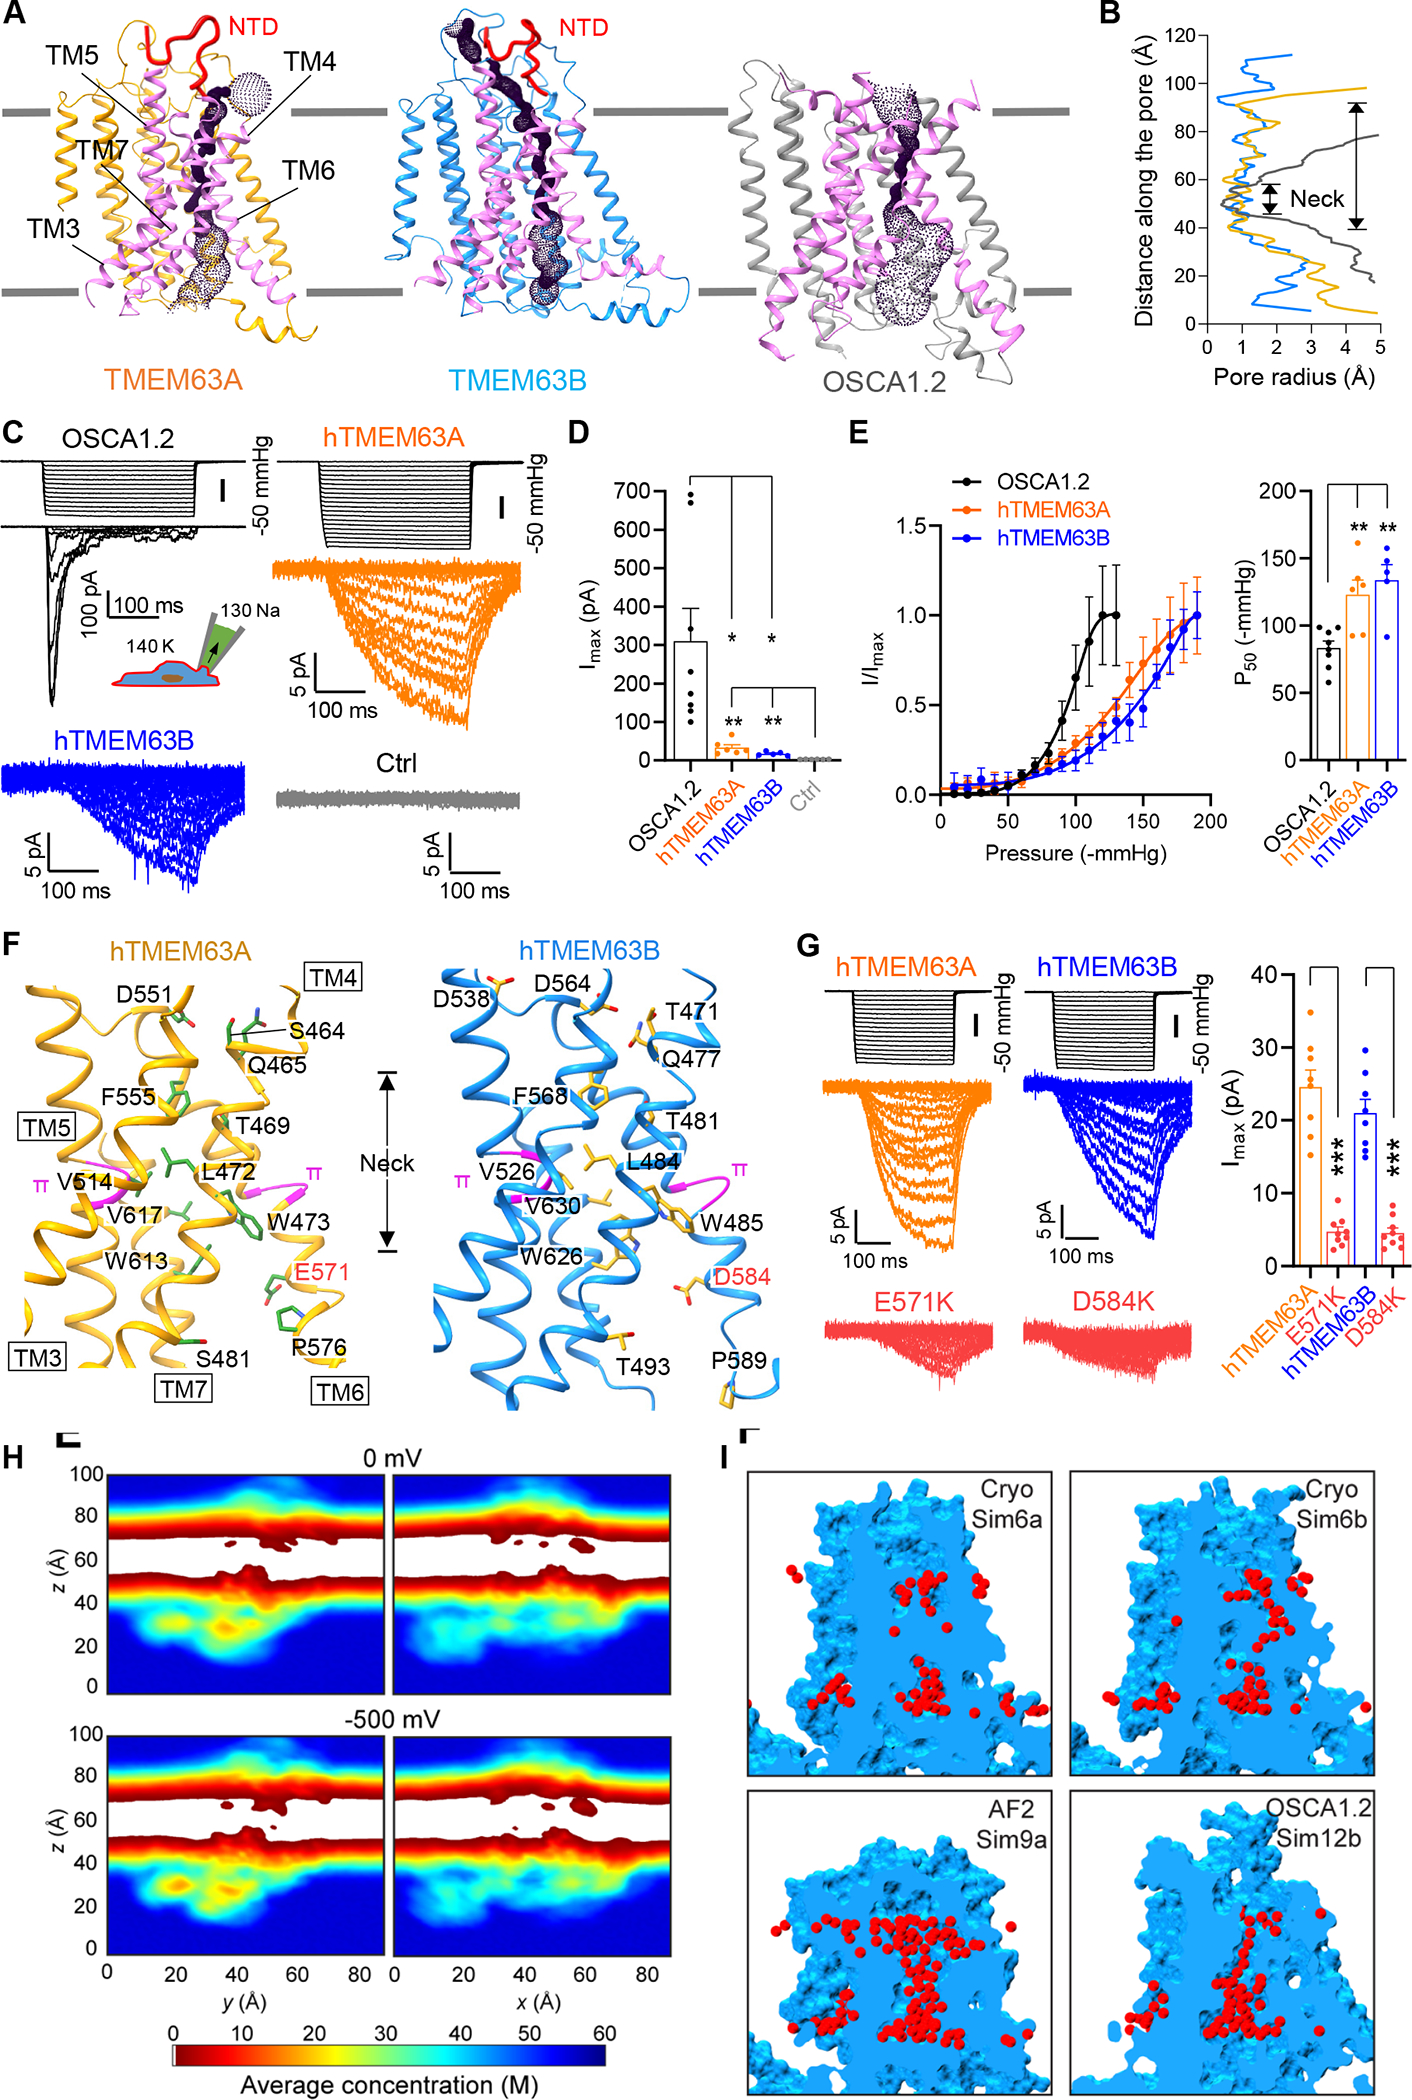
Figure 3. Ion permeation pores in TMEM63s.

(A) Predicted location of the pore in TMEM63A, TMEM63B and OSCA1.2 (PDB: 6MGV). Pore-lining TMs are colored in magenta and N-terminal domains (NTDs) in TMEM63A and TMEM63B are accentuated by thickening line and colored in red.
(B) Van der Waals pore radii against distance along the pore, with neck regions indicated.
(C) Representative traces of stretch-activated currents (−80 mV) from HEK293T cells without (Ctrl) or with indicated protein overexpression. A diagram was shown to indicate main cations (mM) used in the bath and pipette solutions.
(D) Quantification of maximal current amplitude (Imax) from individual patches. *p<0.05, **p<0.01
(E) Left, Average and normalized pressure-response current curves fitted with a Boltzmann equation. OSCA1.2 (N = 8), hTMEM63A (N = 6), hTMEM63B (N = 5). Right, quantification of P50 values. **p<0.01.
(F) Pore-lining residues in TMEM63A (Left) and TMEM63B (Right) from HOLE analysis.
(G) Left, representative traces of stretch-activated currents from HEK293T cells expressing hTMEM63A, hTMEM63B or indicated mutants; Right, quantification of Imax. ***p<0.001.
(H) Two-dimensional slices showing time- and space-averaged water concentrations for different all-atom MD simulations (Sim1a – top; Sim1b – bottom; see also Figure S7).
(I) Examples of transient water channels formed in simulations of our experimentally derived TMEM63B model (Sim6a and Sim6b), of an AlphaFold2 (AF2) TMEM63B model (Sim9a), and of an experimentally derived model of OSCA1.2.
