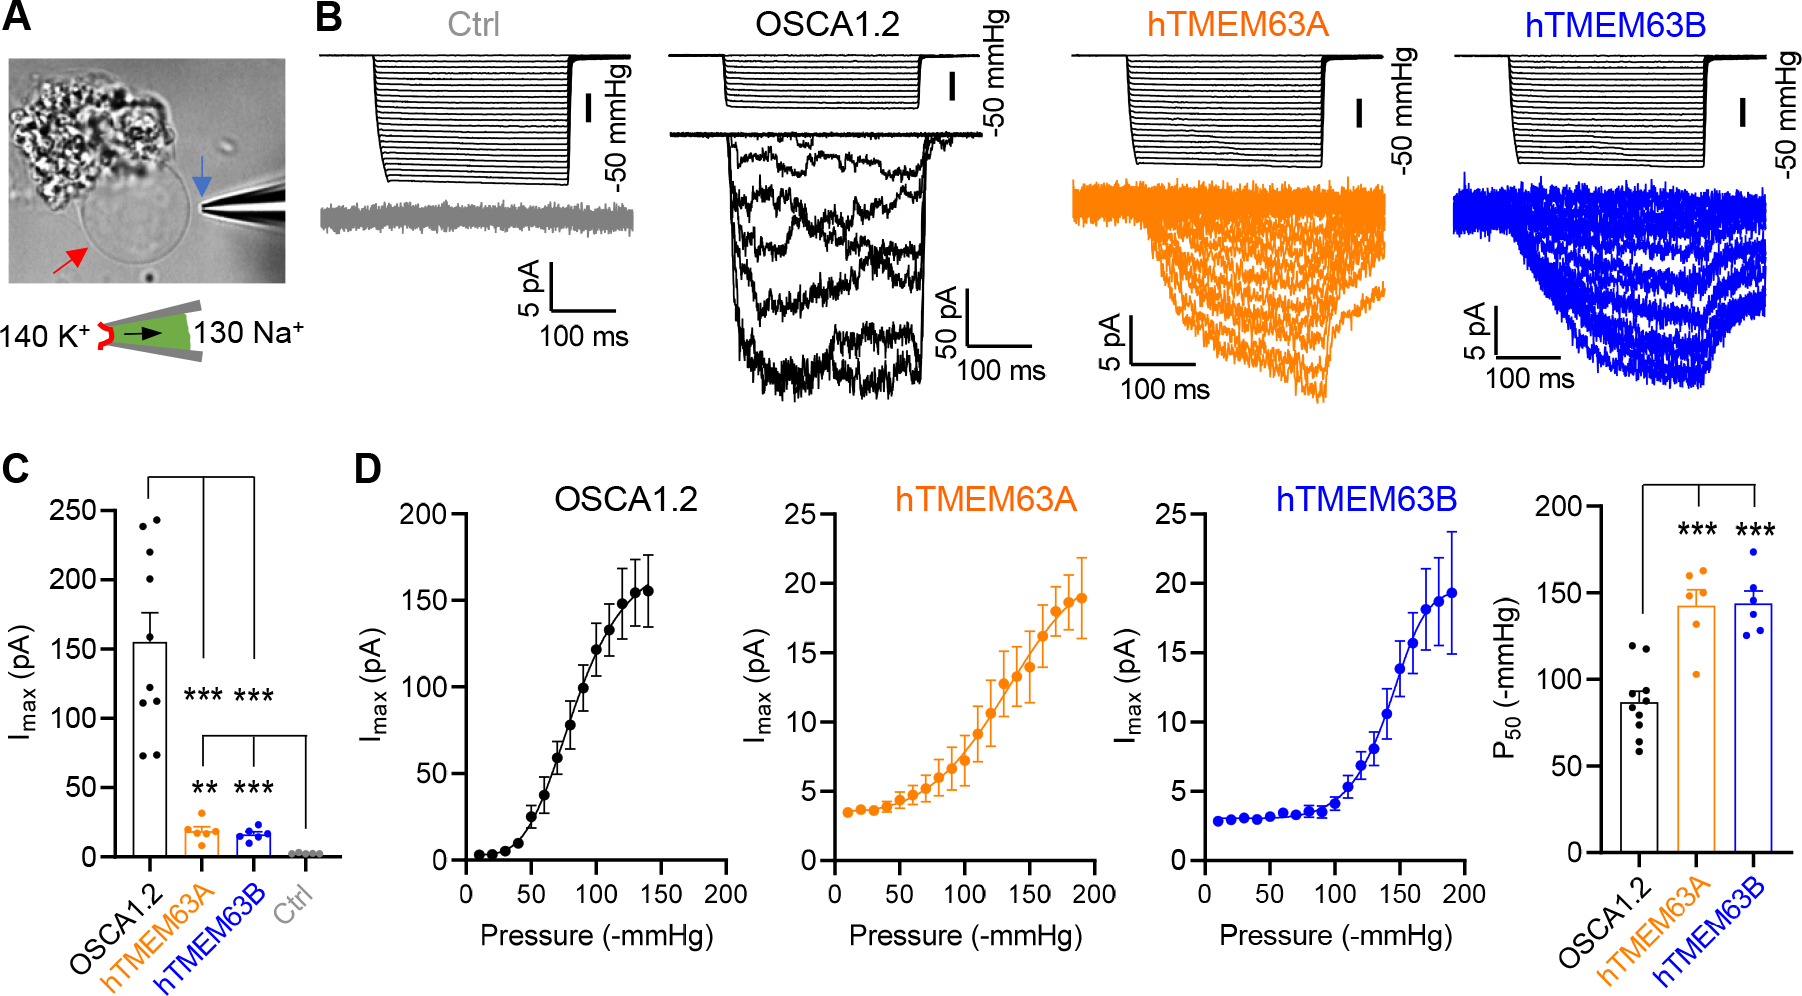
Figure 4. TMEM63A and TMEM63B form high-threshold mechanosensitive ion channels.

(A) Representative image showing a proteoliposome, indicated by a red arrow, grown from the lipid cloud. A recording pipette, indicated by a blue arrow, is also shown for excised patch recording.
(B) Representative traces of stretch-activated currents from unilamellar liposomes reconstituted without (Ctrl) or with indicated purified proteins.
(C) Quantification of Imax. OSCA1.2 (N = 10), hTMEM63A (N = 6), hTMEM63B (N = 6) or Ctrl (N = 5). **p<0.01, ***p<0.001.
(D) Average pressure-response current curves fitted with a Boltzmann equation for OSCA1.2 (N = 10), hTMEM63A (N = 6) and hTMEM63B (N = 6). The right panel shows quantification of P50 values. ***p<0.001.
See also Figure S1.
