
Figure 5. The oligomeric configuration affects mechanosensitivity of OSCA/TMEM63s.
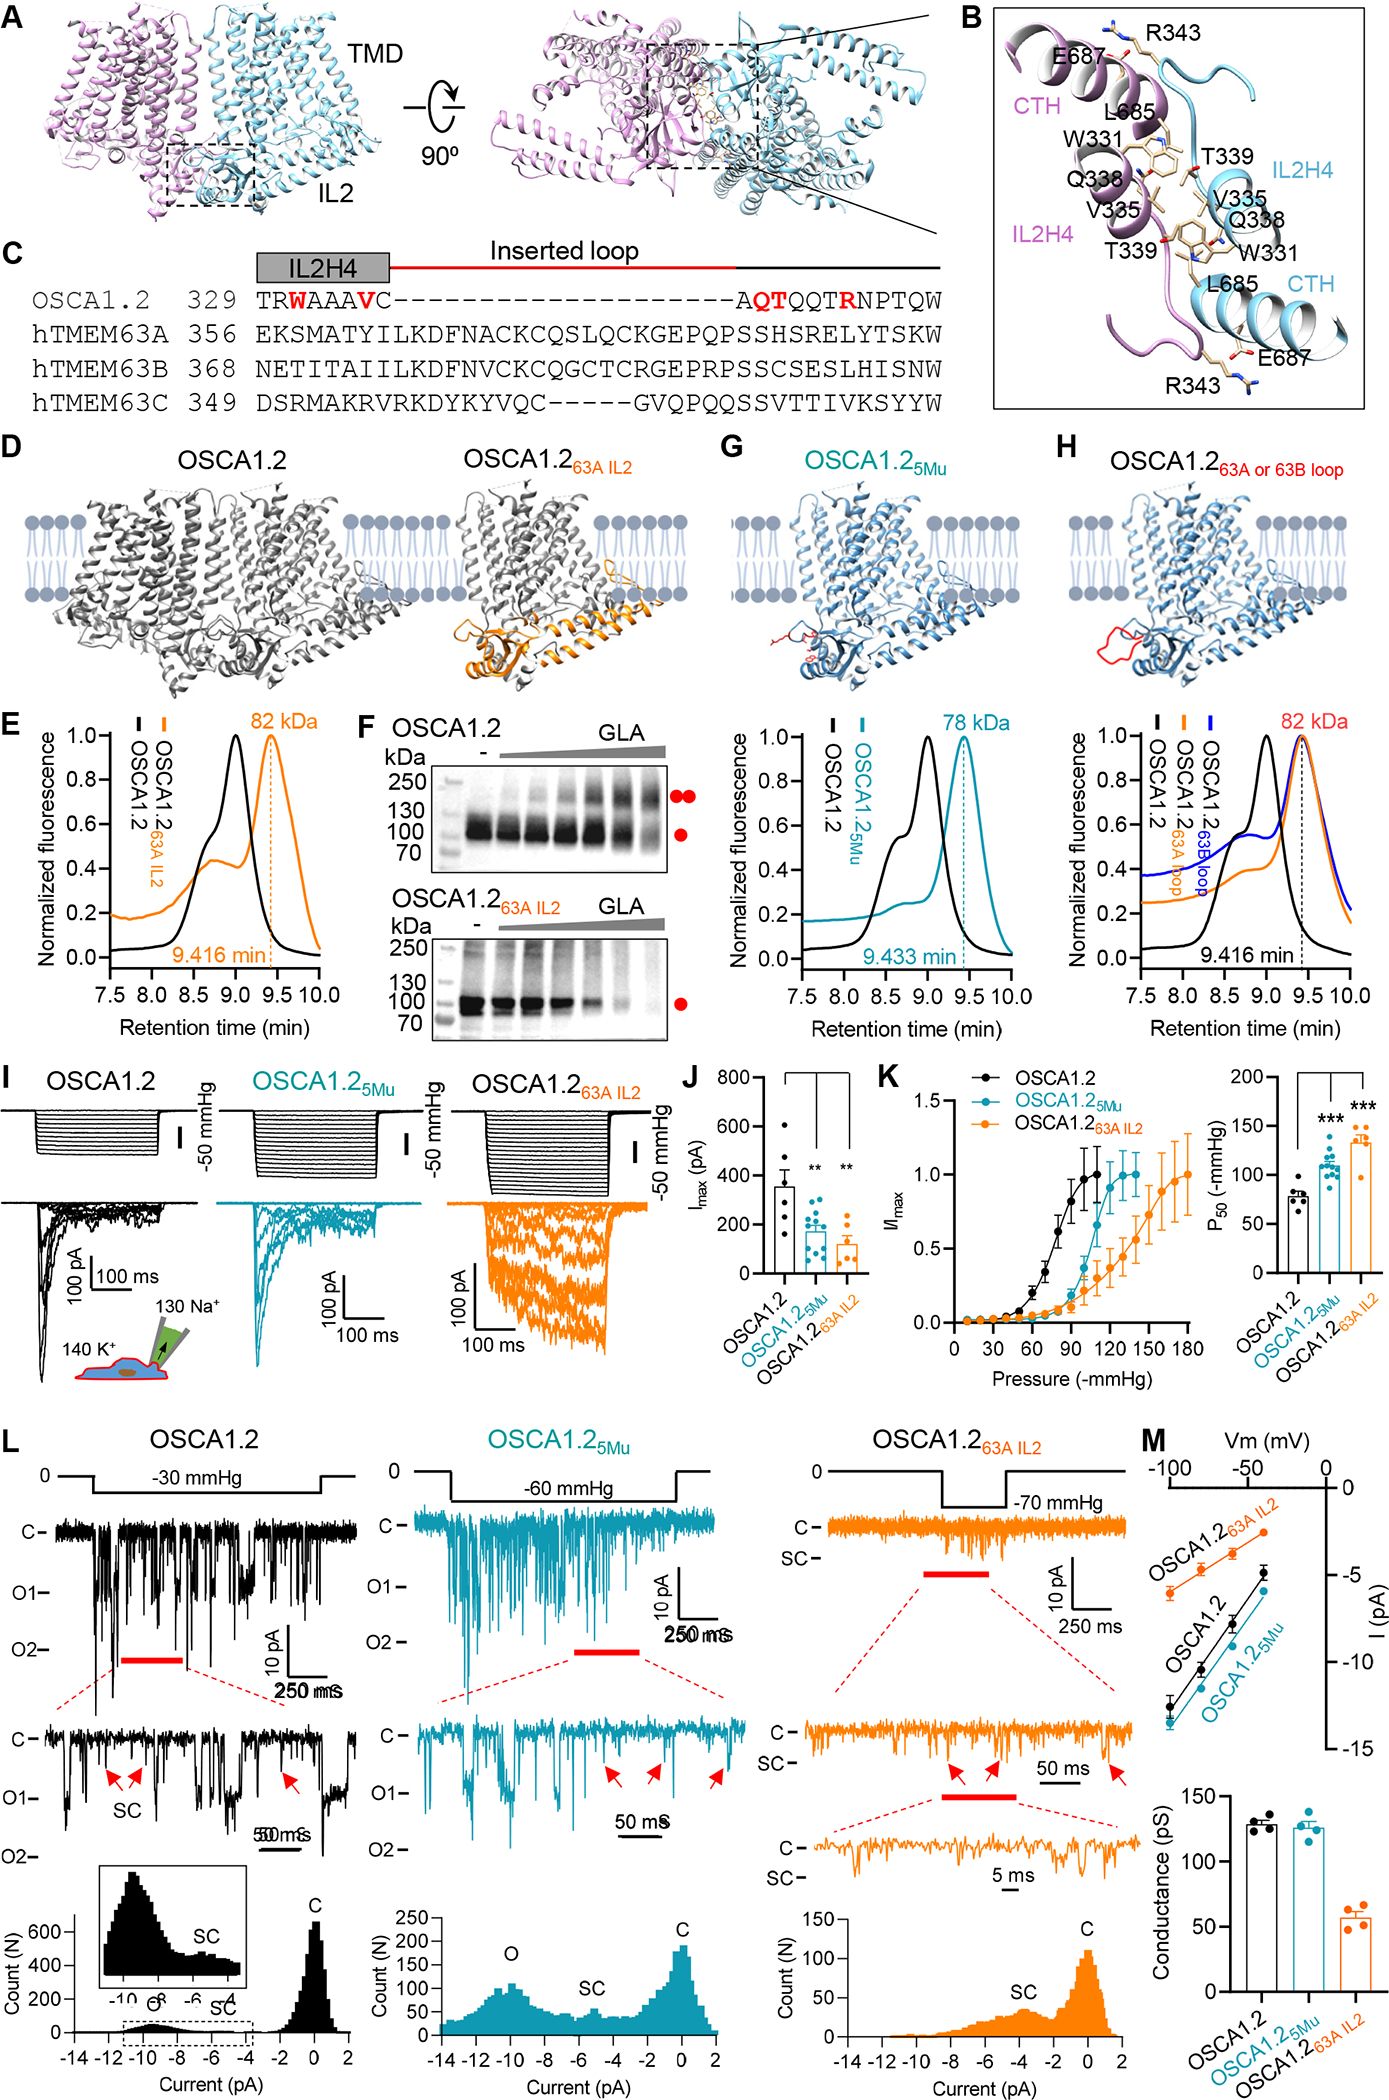
(A) Side and bottom views of dimeric OSCA1.2 (PDB: 6MGV). The rectangle indicates the dimerization interface in IL2.
(B) Enlarged dimerization interface in OSCA1.2, with interacting residues are shown. CTH, C-terminal helix (L685-R698).
(C) Sequence alignment of the region within IL2 that mediates the dimerization of OSCA1.2. Residues that directly mediate OSCA1.2 dimerization are highlighted in red. The inserted loop in TMEM63s is indicated by the red line.
(D) Illustrations of dimeric OSCA1.2 and monomeric chimera protein OSCA1.263A IL2.
(E) Normalized FSEC traces of GFP-tagged OSCA1.2 and OSCA1.263A IL2, with MW of the OSCA1.263A IL2 (without GFP) indicated.
(F) Representative western blots of GFP-tagged OSCA1.2 (upper) or OSCA1.263A IL2 (lower). Cell lysates were treated without or with GLA at various concentrations (in mM: 0.3125, 0.625, 1.25, 2.5, 5, 10).
(G) Illustration of monomeric OSCA1.25Mu mutant containing 5 mutations, W331G, V335G, Q338G, T339G R343A (Upper), and normalized FSEC traces (Lower).
(H) Illustration of monomeric OSCA1.2 with inserted 20-aa loop from hTMEM63A (OSCA1.263A loop) or hTMEM63B (OSCA1.263B loop) (Upper) and normalized FSEC traces (Lower).
(I and J) Representative traces of stretch-activated currents recorded from HEK293T cells (I) and quantification of Imax (J). **p<0.01.
(K) Left, average and normalized pressure-response current curves fitted with a Boltzmann equation for OSCA1.2 (N = 6), OSCA1.25Mu (N = 12), OSCA1.263A IL2 (N = 6); Right, quantification of P50 from individual patches. ***p<0.001.
(L) Single-channel currents recorded at −80 mV. The closed (C) and fully open (O) states are indicated. Red arrows mark the assumed sub-conductance (SC) state. Current amplitude histogram for each trace is shown at the bottom.
(M) Upper, averaged current-voltage relationship. OSCA1.2 (N = 4), OSCA1.25Mu (N = 4), OSCA1.263A IL2 (N = 4); Lower, the mean single-channel conductance from individual patches.
See also Figure S9.