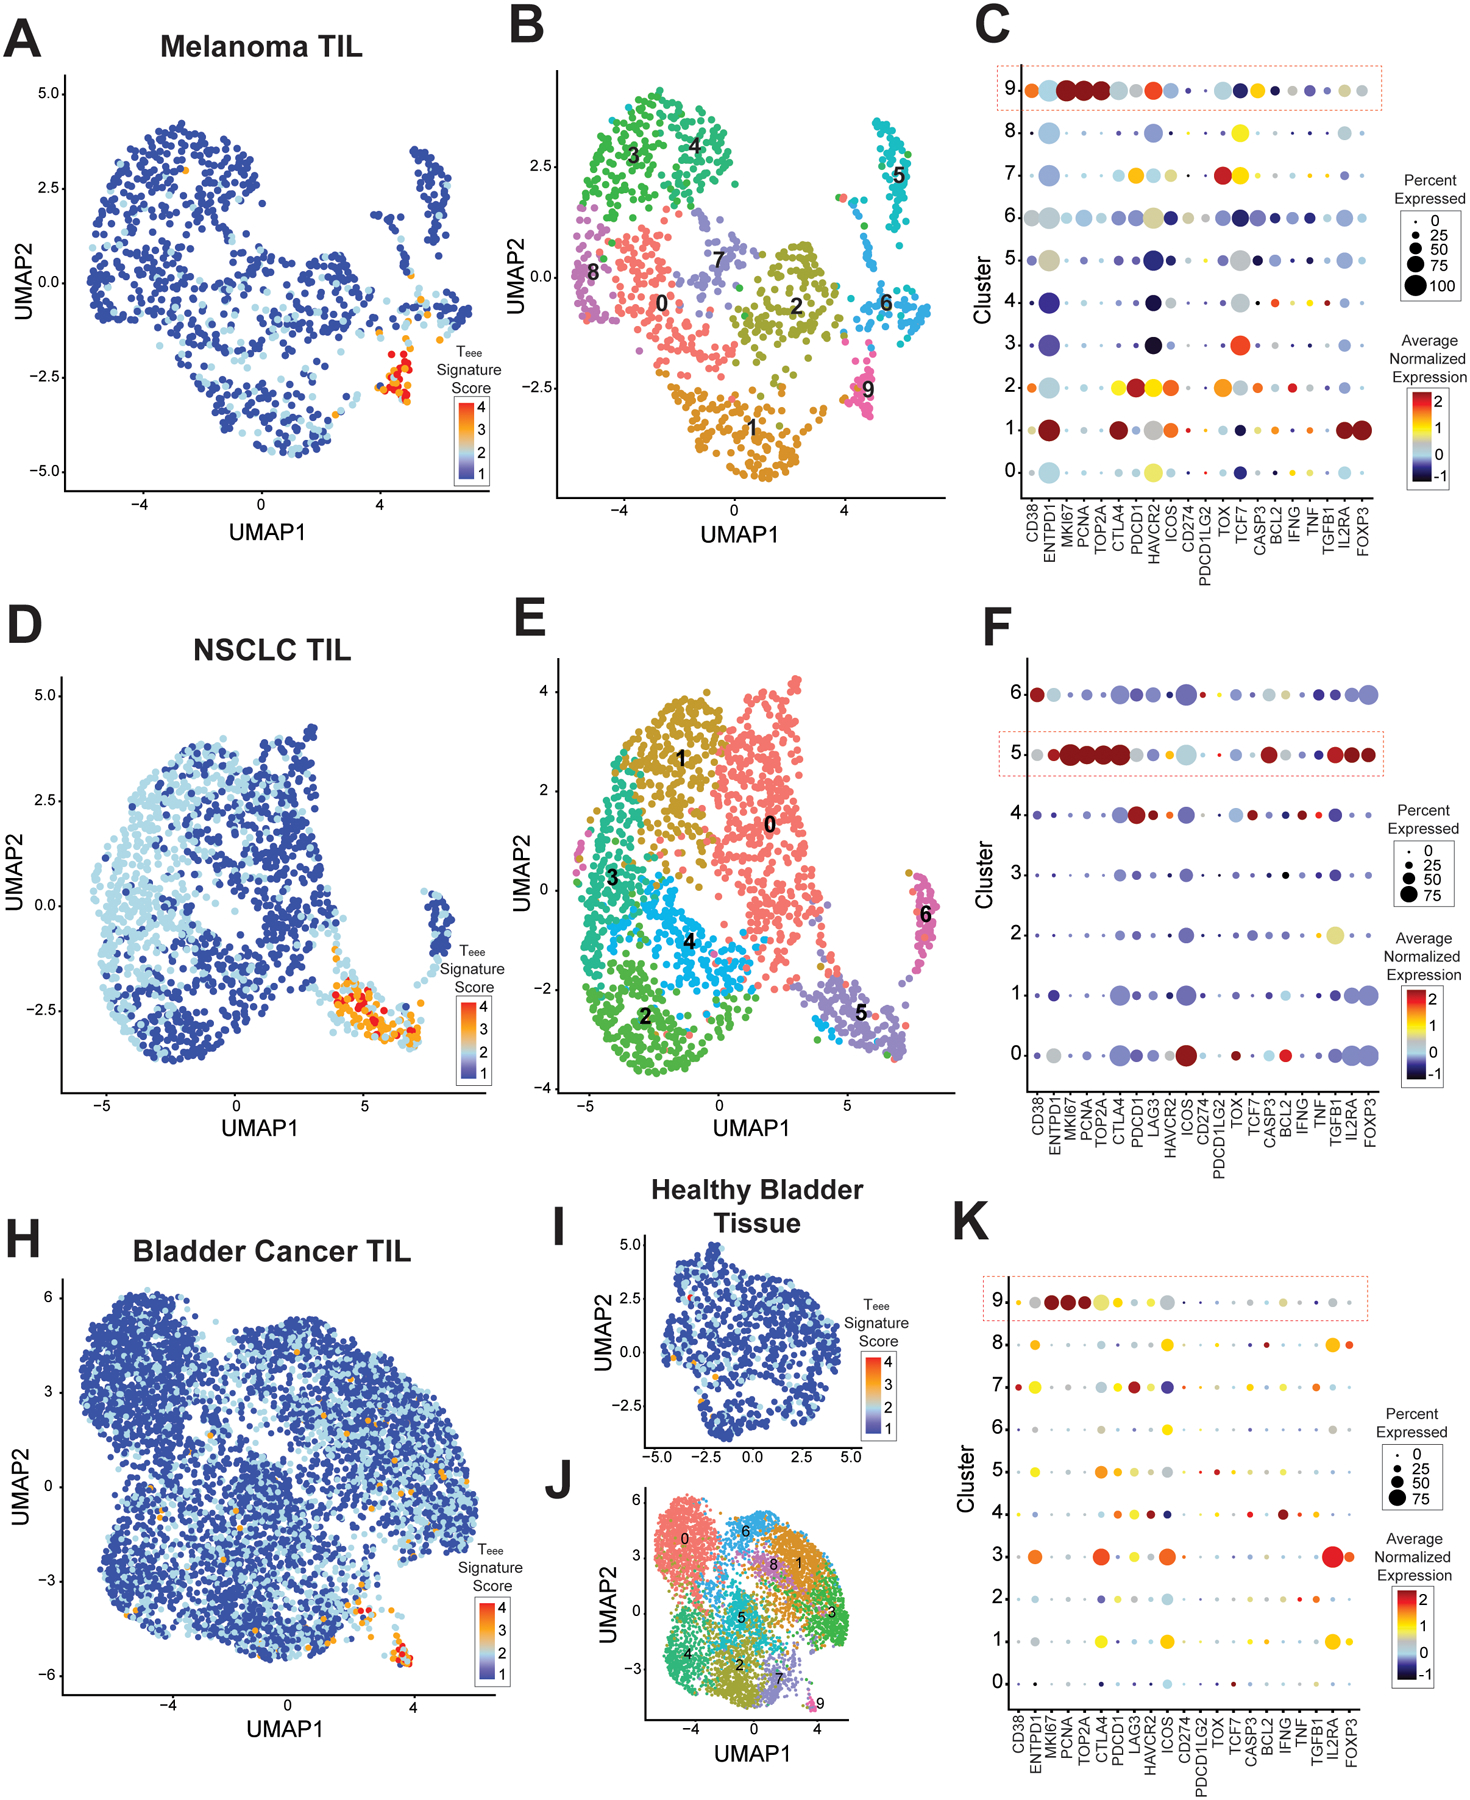
Figure 3. Cells with a Teee gene signature are present in TIL from melanoma, NSCLC, and bladder cancer.

Publicly available single-cell RNA-seq datasets were analyzed for the presence of Teee cells. (A-C) Melanoma dataset GSE115978. (A) A UMAP plot of is shown of the CD3+CD4+ TIL concatenated across samples. Cells are colored by expression of the Teee signature genes, with higher expression scores shown in red. (B) The same UMAP plot is shown, colored by clusters. (C) A dot plot is shown with each row showing a cluster and the columns showing select genes. Genes with higher average expression in a cluster are colored red, genes with lower expression are colored blue, and genes with intermediate expression are colored yellow. Larger circle size denotes expression by higher proportion of cells within that cluster. (D-F) Non-small cell lung cancer dataset GSE179994. UMAP plots of CD3+CD4+ TIL concatenated across samples colored by (D) Teee signature and (E) clustering, (F) and a dot plot as above are shown. (H-K) Bladder cancer dataset GSE149652. UMAP plots of CD3+CD4+ TIL concatenated across samples colored by (H) Teee signature and (J) clustering, (K) and a dot plot as above are shown. (I) A UMAP plot of CD3+CD4+ cells from adjacent healthy bladder tissue is shown. Cells are colored based on Teee signature expression.
