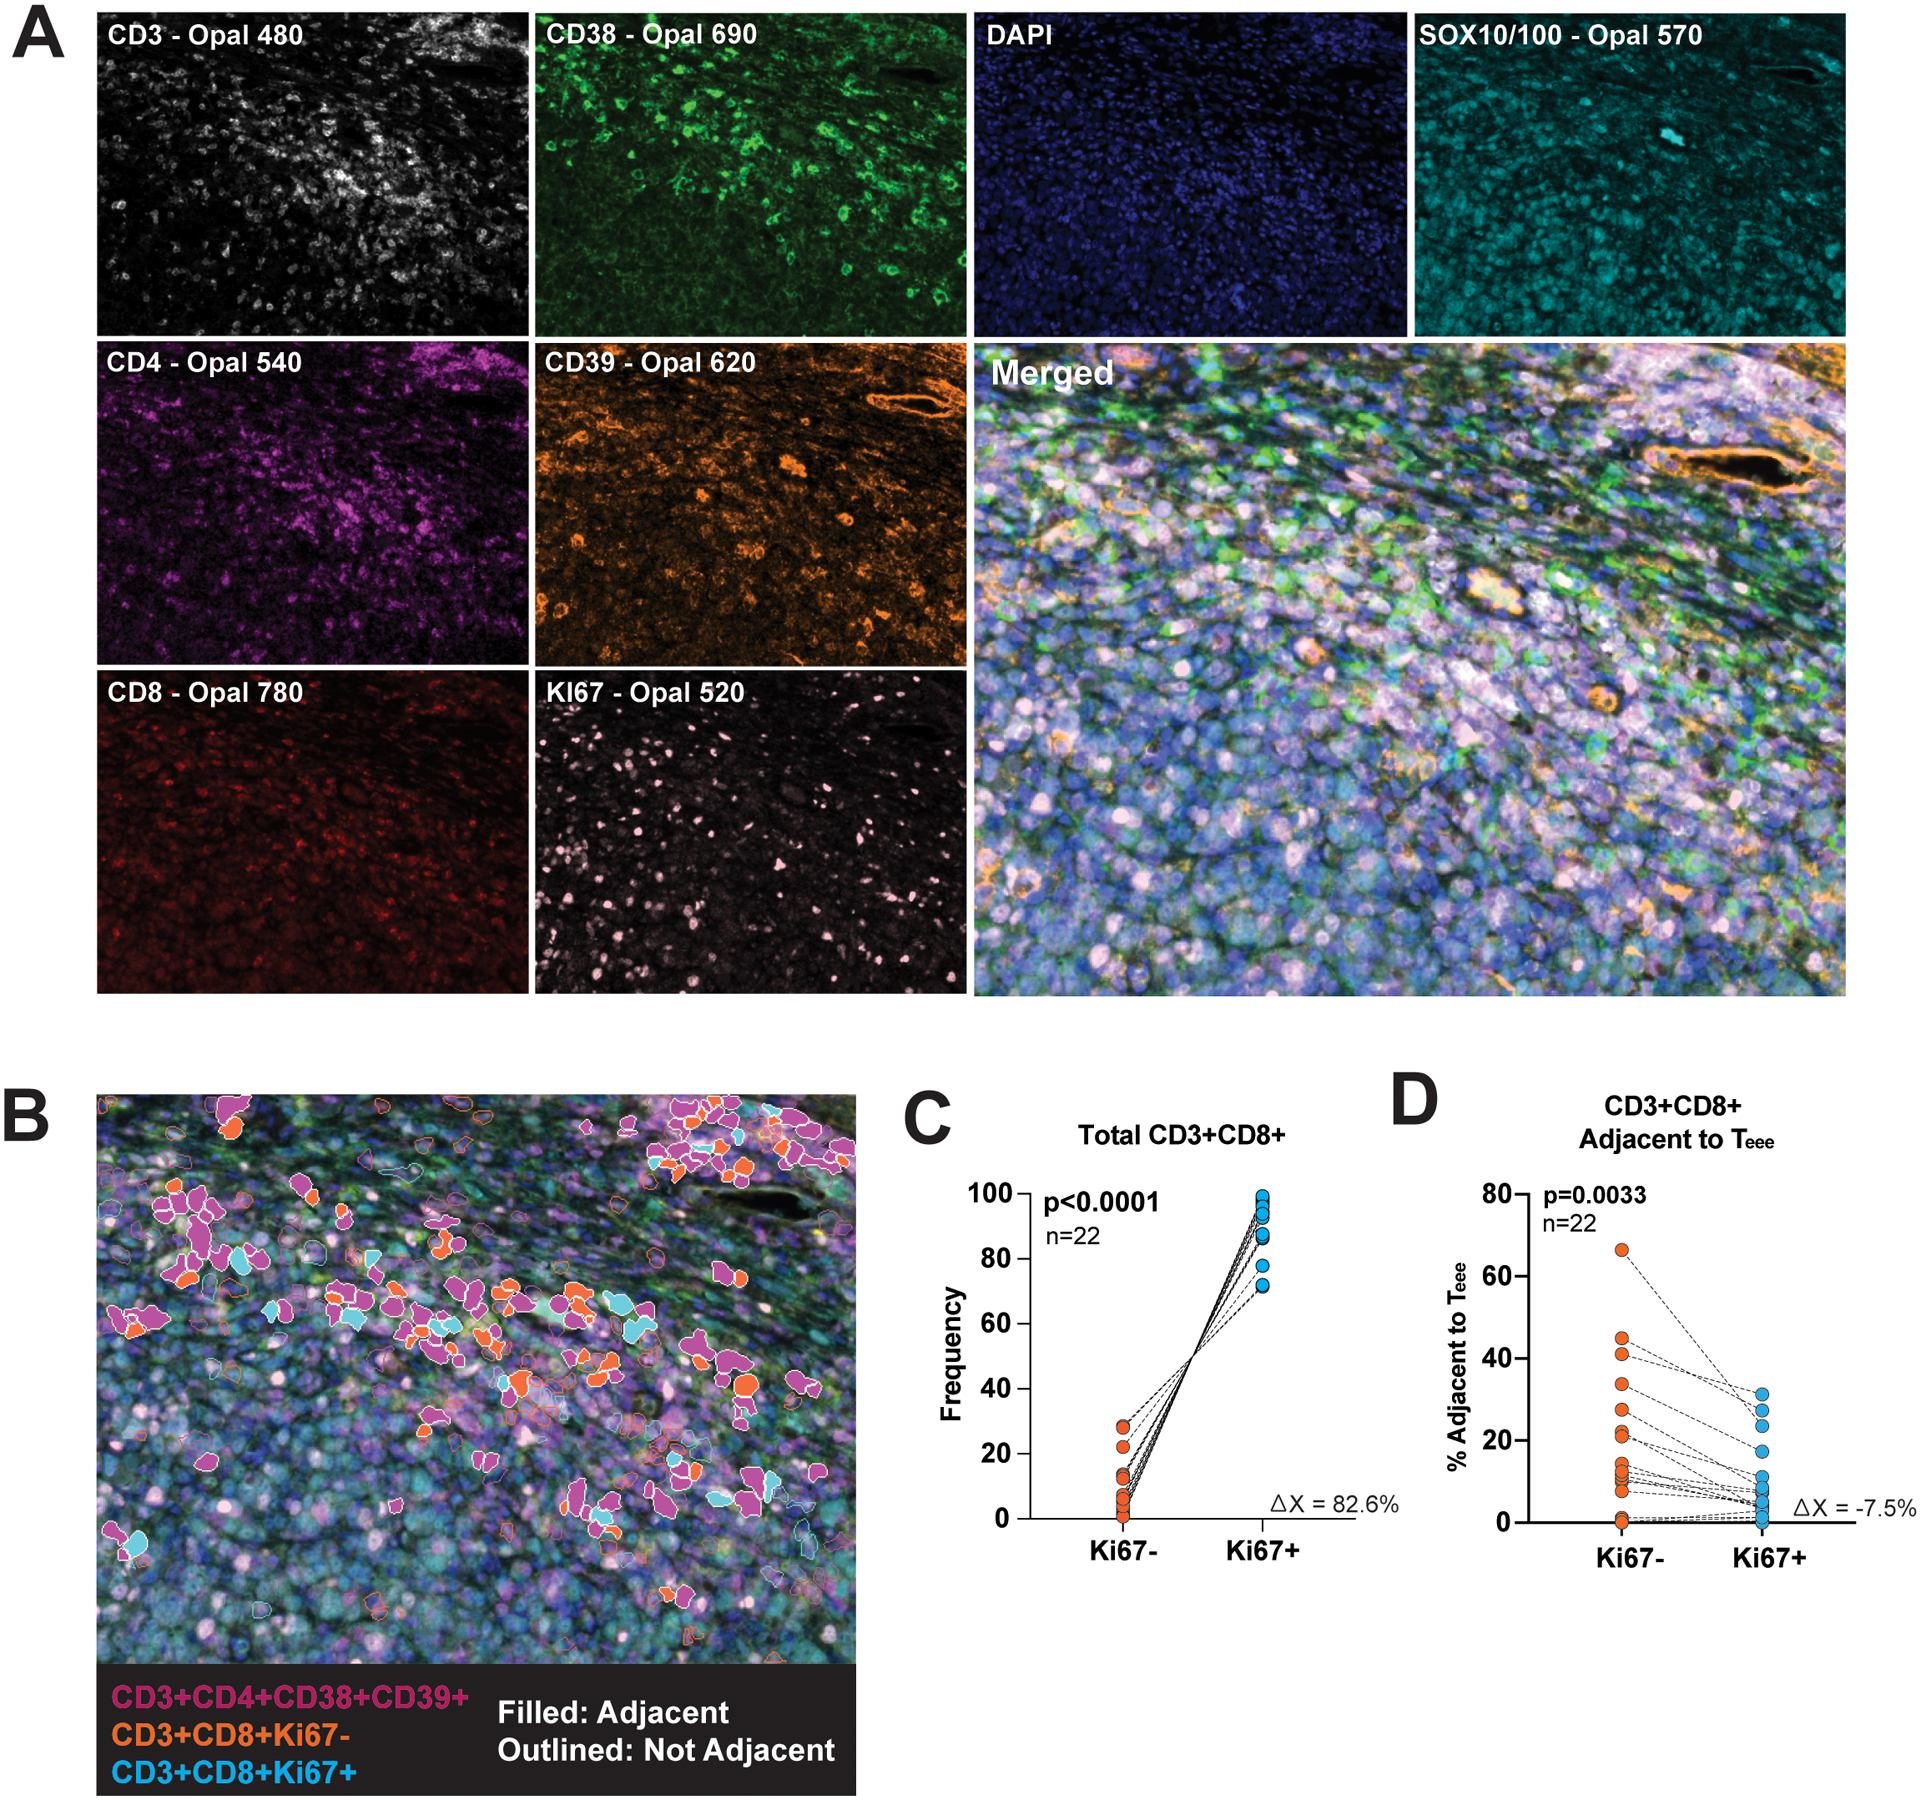
Figure 4. CD3+CD4+CD38+CD39+ cells found in the melanoma tumor microenvironment are associated with Ki67- CD8+ T-cells.

Baseline tumor tissue FFPE samples from metastatic melanoma patients treated with checkpoint inhibition were evaluated by multiplex immunofluorescent imaging. (A) Representative images of CD3 (white), CD38 (green), DAPI (blue), SOX10/100 (cyan), CD4 (purple), CD39 (orange), CD8 (red), and Ki67 (pink) staining, along with the merged image are shown. (B) Cells expressing the marker set CD3+CD4+CD38+CD39+ are artificially colored purple, CD3+CD8+Ki67- cells colored orange and CD3+CD8+Ki67+ colored blue. CD3+CD4+CD38+CD39+ and CD3+CD8+ cells in contact with one another are filled in by color and those not in contact are only outlined. (C) The frequency of Ki67- and Ki67+ CD3+CD8+ cells in each specimen are plotted. Each dot pair represents one patient. (D) The frequency of CD3+CD8+Ki67- and CD3+CD8+Ki67+ adjacent to CD3+CD4+CD38+CD39+ cells as a percent of the parent Ki67−/+ populations are plotted. Each dot pair represents one patient. The corresponding p-value was determined by a paired t-test.
