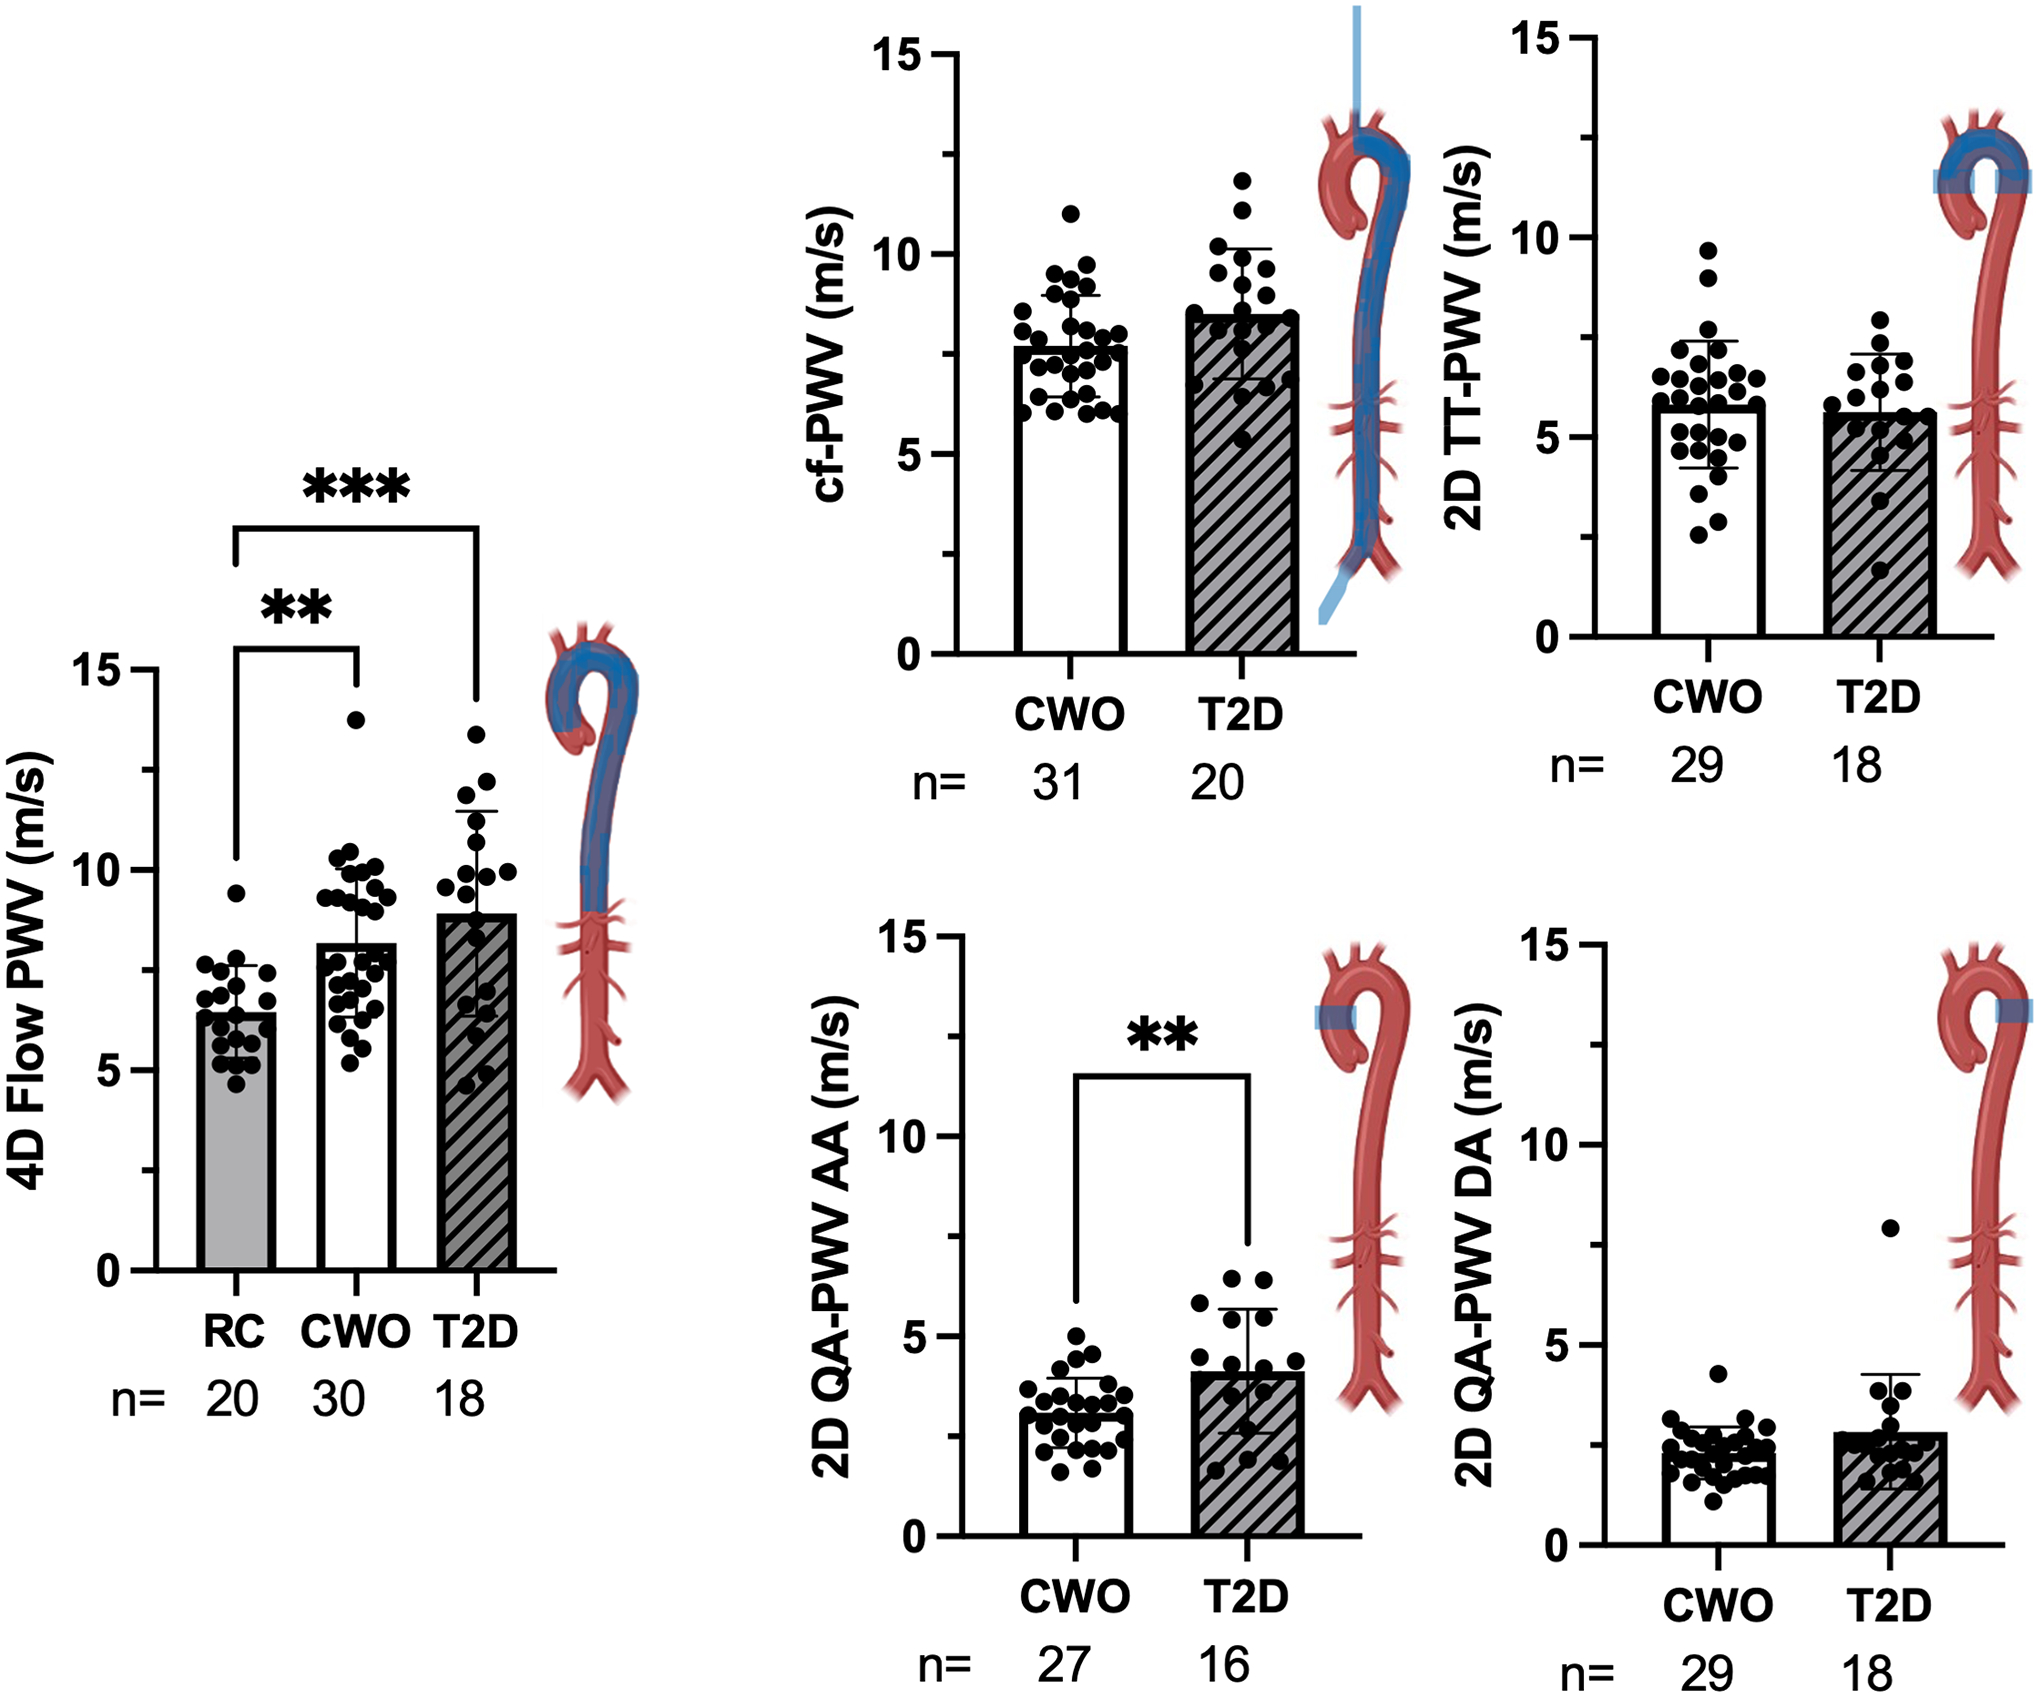
Figure 2.

Arterial stiffness: Region assessed per diagram. RC=reference control, CWO=controls with overweight/obesity, T2D=participants with type 2 diabetes, PWV=pulse wave velocity, cf=carotid-femoral, QA=flow-area, TT=transit-time, AA=Ascending aorta, DA=Descending aorta. *Significantly different from BMI-similar control group with p<0.05. **p<0.01, ***p<0.001.
