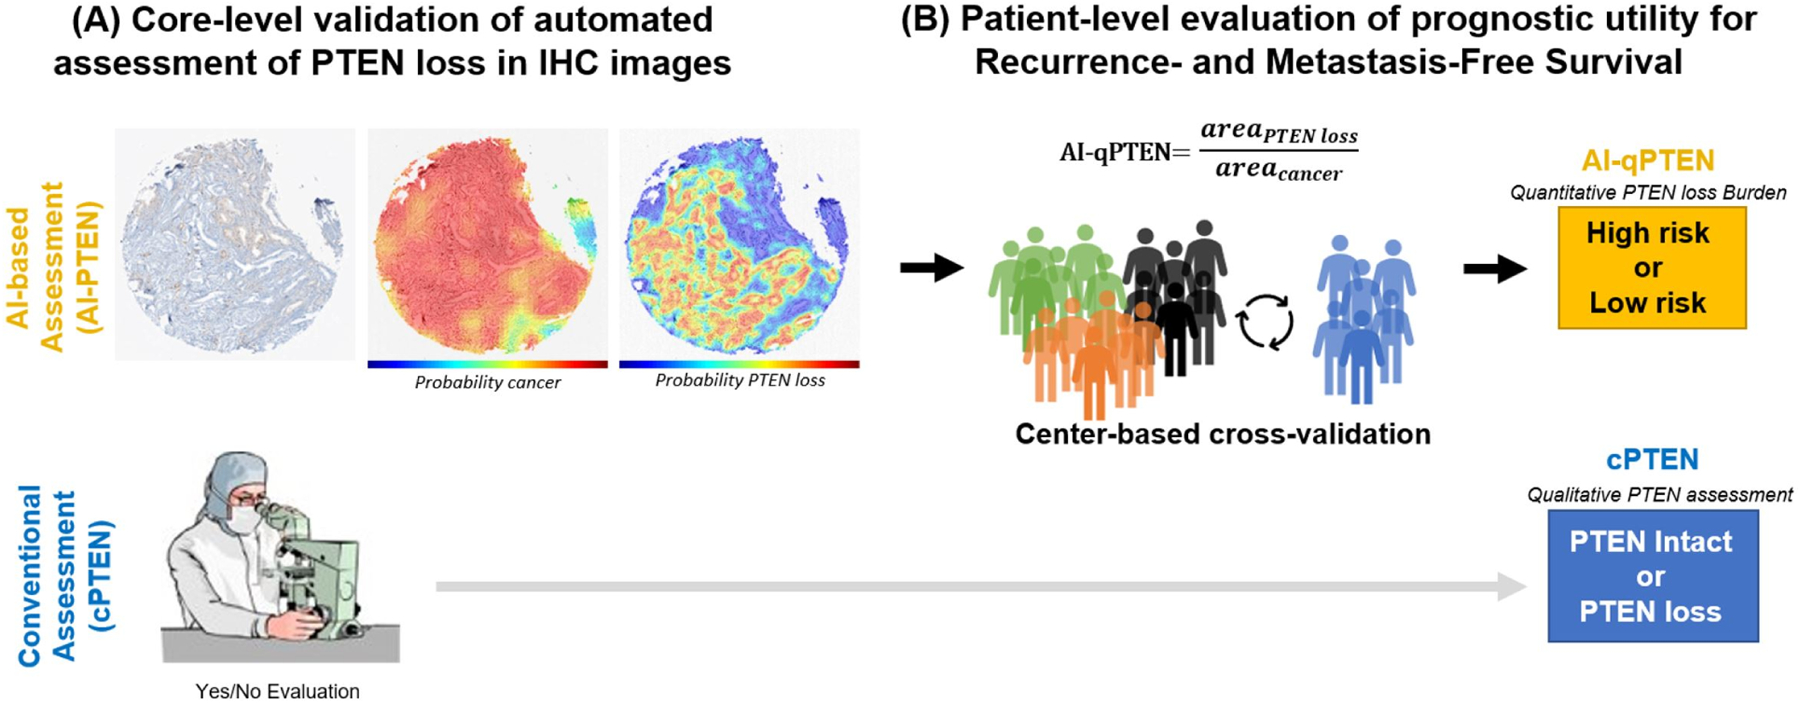
Figure 1. Image Analysis Pipeline.

(A) Core-level Analysis: Each TMA core is assessed independently, undergoing cancer detection and PTEN loss identification (classifier followed by pixel-based segmentation). The final output is an area estimate for PTEN loss area and cancer area. A representative core is shown with partial PTEN loss, i.e. not all cancer areas exhibiting loss. An expert pathologist performs qualitative assessment for each core. (B) Patient-level Analysis: All cores from an individual patient are aggregated and selected by total tumor content based on cross-validation analysis before a patient-level estimate of PTEN loss relative to cancer burden (AI-qPTEN) is calculated. Clinically relevant cut-points for an association of AI-qPTEN with patient outcomes are identified through a modified CV partitioned by the institution/center. Conventional assessment (cPTEN) is determined by qualitative review across all cores. AI: Artificial intelligence, AI-qPTEN: AI-based quantitative PTEN loss, TMA: Tissue Micro-Array, CV: cross-validation
