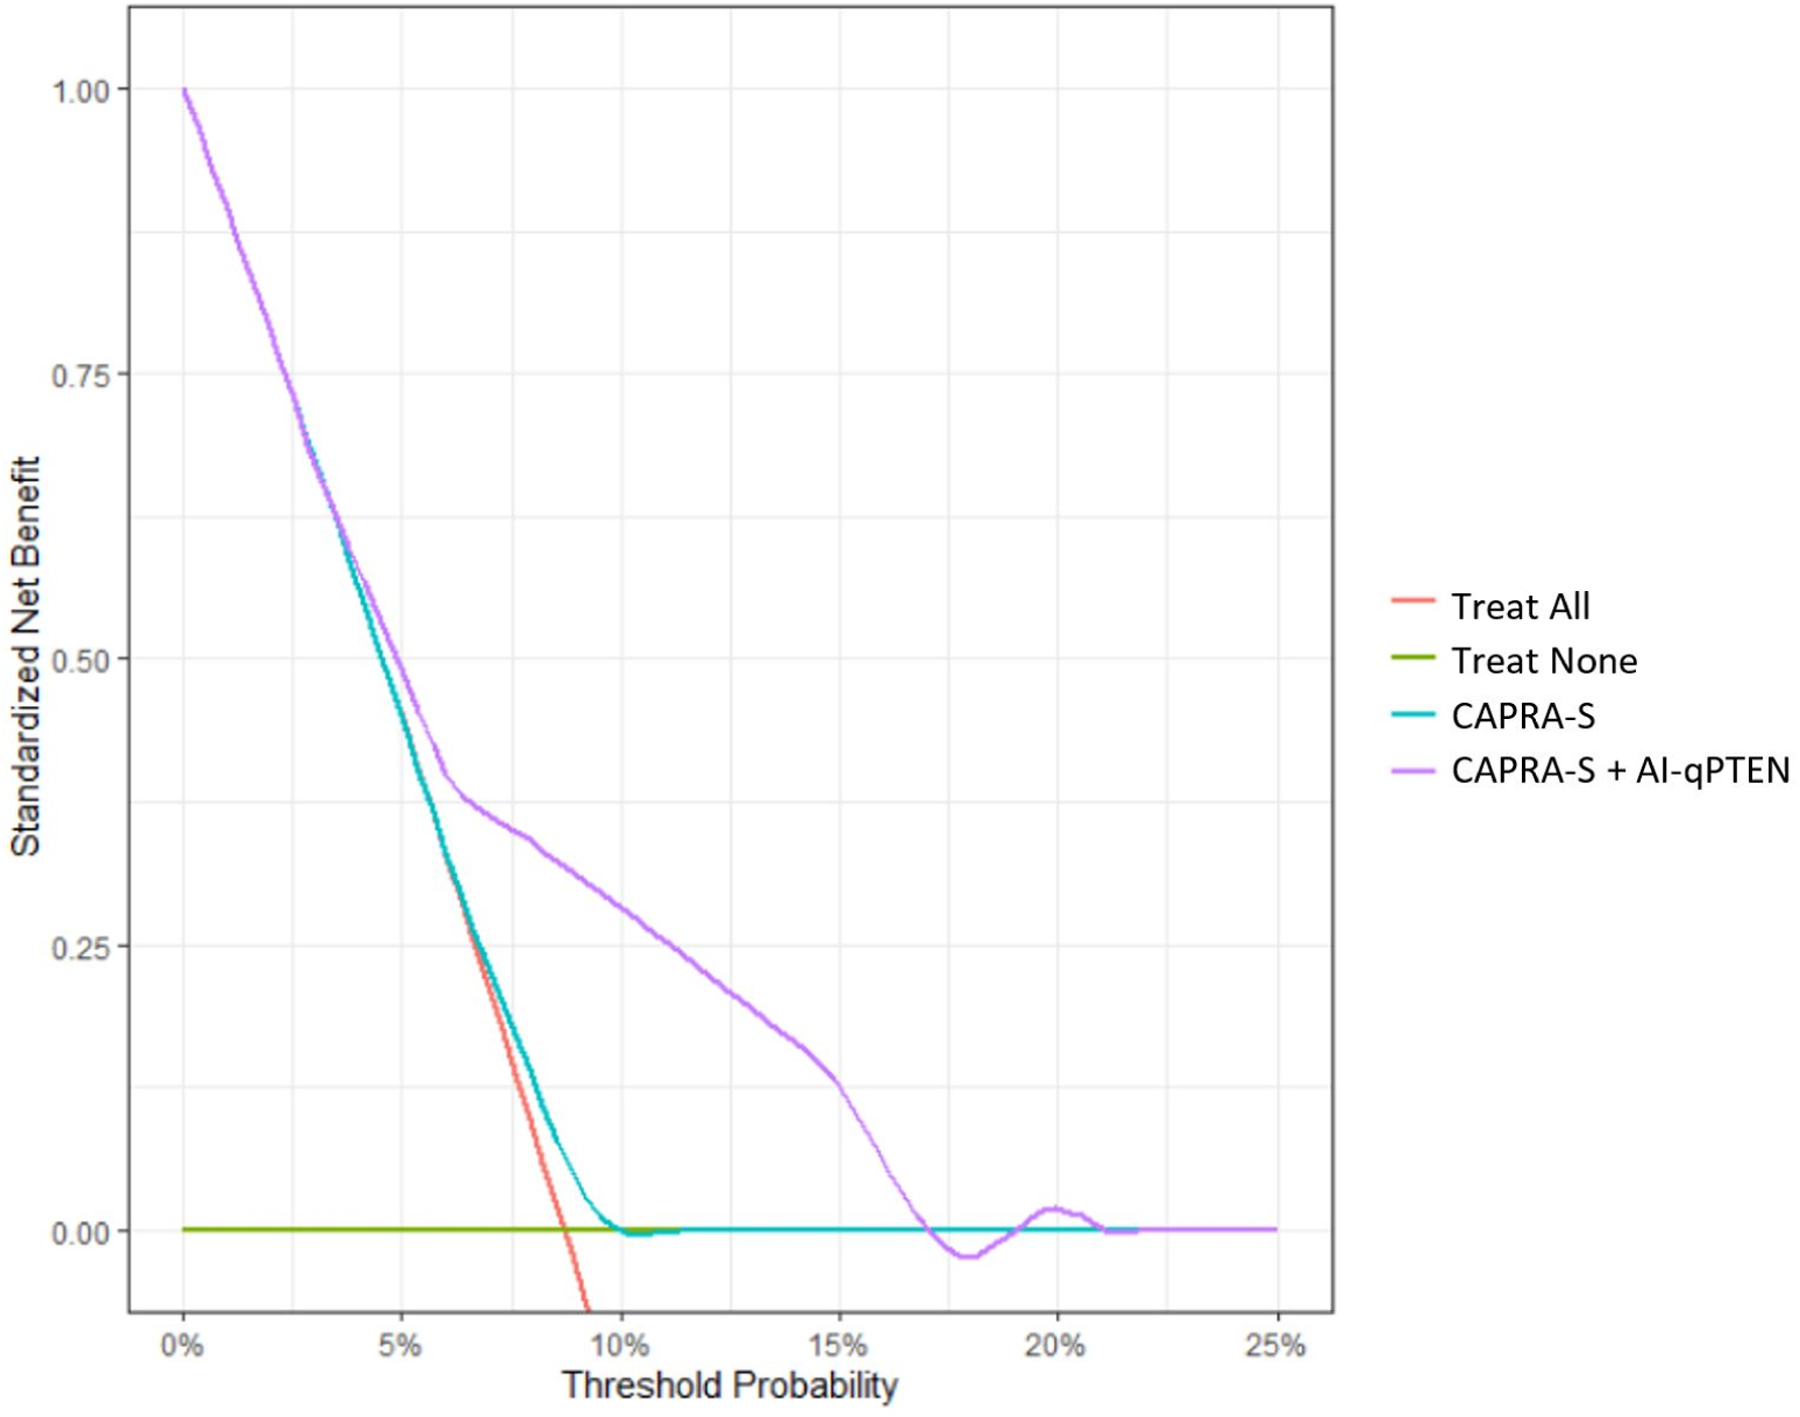
Figure 3.

Decision curve analysis assessing the added benefit of including High-Risk AI-qPTEN (>0.04) in patients classified as low risk by CAPRA-S. Net increase in the proportion of men appropriately identified for therapeutic intervention post-surgery is shown on the y-axis and the associated probabilities on the x-axis. The green line represents a strategy of treating no men, assuming none of them experience metastasis. The orange line on the other hand assumes that all men will develop metastasis and therefore all men are treated. Multivariable models of CAPRA-S with and without High-Risk AI-qPTEN are shown as teal and purple lines, respectively. A combined model involving CAPRA-S and High-Risk AI-qPTEN showed greater net benefit across all threshold probabilities, signifying the ability to appropriately identify patients initially diagnosed with low risk PCa for additional therapeutic interventions after surgery. PCa: Prostate Cancer, CAPRA-S: Cancer of the Prostate Risk Assessment (CAPRA) post-surgical score, cPTEN: Conventional visual scoring, AI: Artificial intelligence, AI-qPTEN: AI-based quantitative PTEN loss
