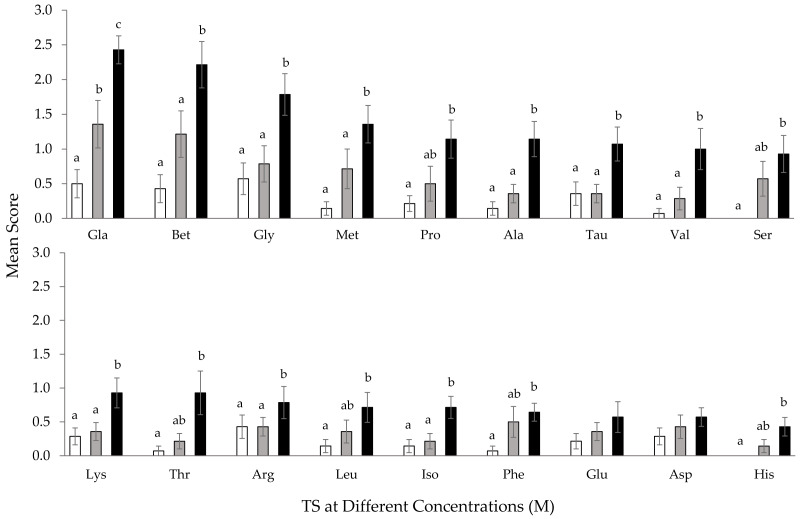
Figure 4. Comparison of mean response score of wild-caught T. orientalis towards 10−3 M (empty bar), 10−2 M (grey bar) and 10−1 M (black bar) concentrations of each test stimuli (TS).
Different superscript alphabets indicate a significant difference between concentrations of each TS at P < 0.05. Vertical bars indicate standard error.

