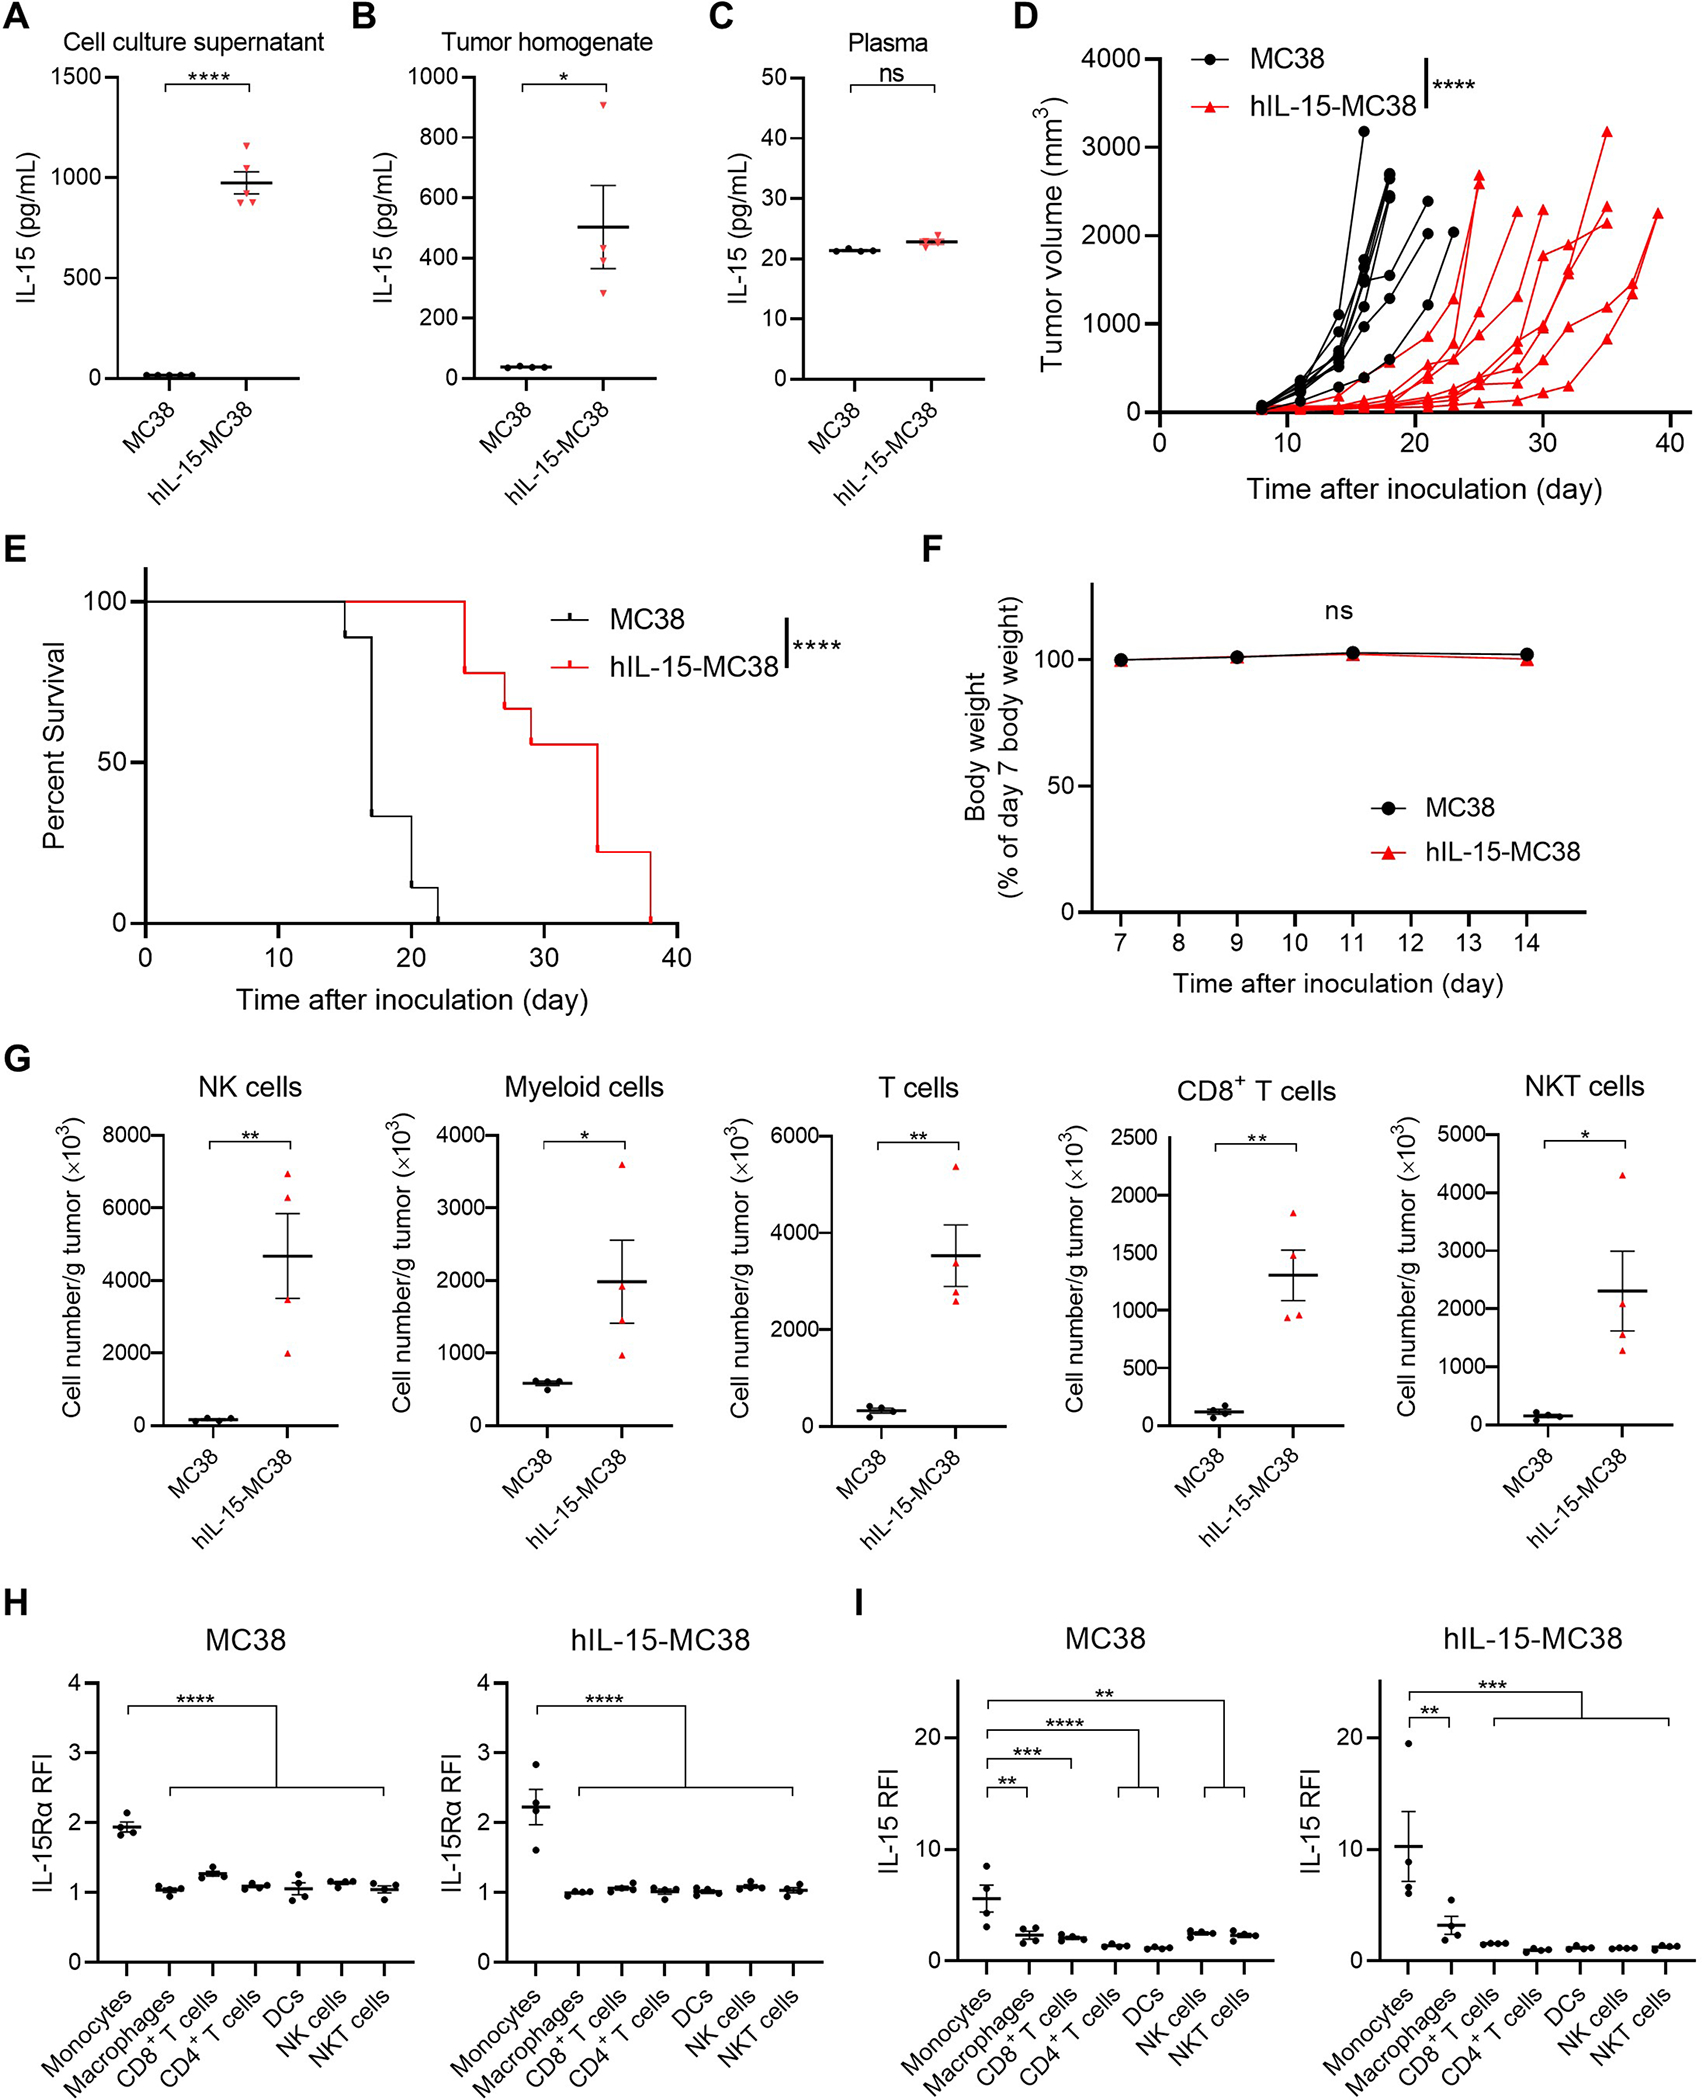
Figure 2.

Characterization of hIL-15-MC38 cells in comparison with parental MC38 cells. A, IL-15 concentrations in cell culture supernatant after 72 h incubation of hIL-15-MC38 or parental MC38 cells (n = 4; mean ± SEM; unpaired t test); ****, p < 0.0001. B, IL-15 concentrations in homogenates of hIL-15-MC38 or parental MC38 tumors (n = 4; mean ± SEM; unpaired t test); *, p < 0.05. Tumors were harvested and tumor homogenates were prepared 14 days after inoculation. C, IL-15 concentrations in serum samples of hIL-15-MC38 or MC38 tumor-bearing mice (n = 4; mean ± SEM; unpaired t test); ns, not significant. Peripheral blood samples were collected and plasma was prepared 14 days after inoculation. D, Growth curves of hIL-15-MC38 or parental MC38 tumors showing delayed growth (n = 9; mean ± SEM; repeated measures two-way ANOVA followed by Sidak’s test); ****, p < 0.0001. E, Survival curves of hIL-15-MC38 or MC38 tumor-bearing mice showing improved survival (n = 9, log–rank test); ****, p < 0.0001. F. Changes in body weight of hIL-15-MC38 or MC38 tumor-bearing mice were minimal. Body weight measurement started seven days after tumor inoculation (n = 5; mean ± SEM; repeated measures two-way ANOVA followed by Sidak’s test); ns, not significant. G, Immune cell expressions in hIL-15-MC38 tumors. hIL-15-MC38 or MC38 tumors were harvested and analyzed by flow cytometry demonstrating significant increase in most immune cell subsets (n = 4; mean ± SEM; unpaired t test); *, p < 0.05; **, p < 0.01. H, IL-15Rα expression in the tumor microenvironments of hIL-15-MC38 or MC38 tumors. hIL-15-MC38 or MC38 tumors were harvested and analyzed by flow cytometry (n = 4; mean ± SEM; one-way ANOVA followed by Tukey’s test); ****, p < 0.0001 vs. monocytes; RFI, relative fluorescence intensity. I, Detection of membrane-bound IL-15 in immune cells of hIL-15-MC38 or MC38 tumors. hIL-15-MC38 or MC38 tumors were harvested and dissociated into single cell suspensions. They were incubated with human IL-15 (500 pM) for 15 minutes and analyzed by flow cytometry (n = 4; mean ± SEM; one-way ANOVA followed by Tukey’s test); **, p < 0.01; ***, p < 0.001; ****, p < 0.0001 vs. monocytes.
