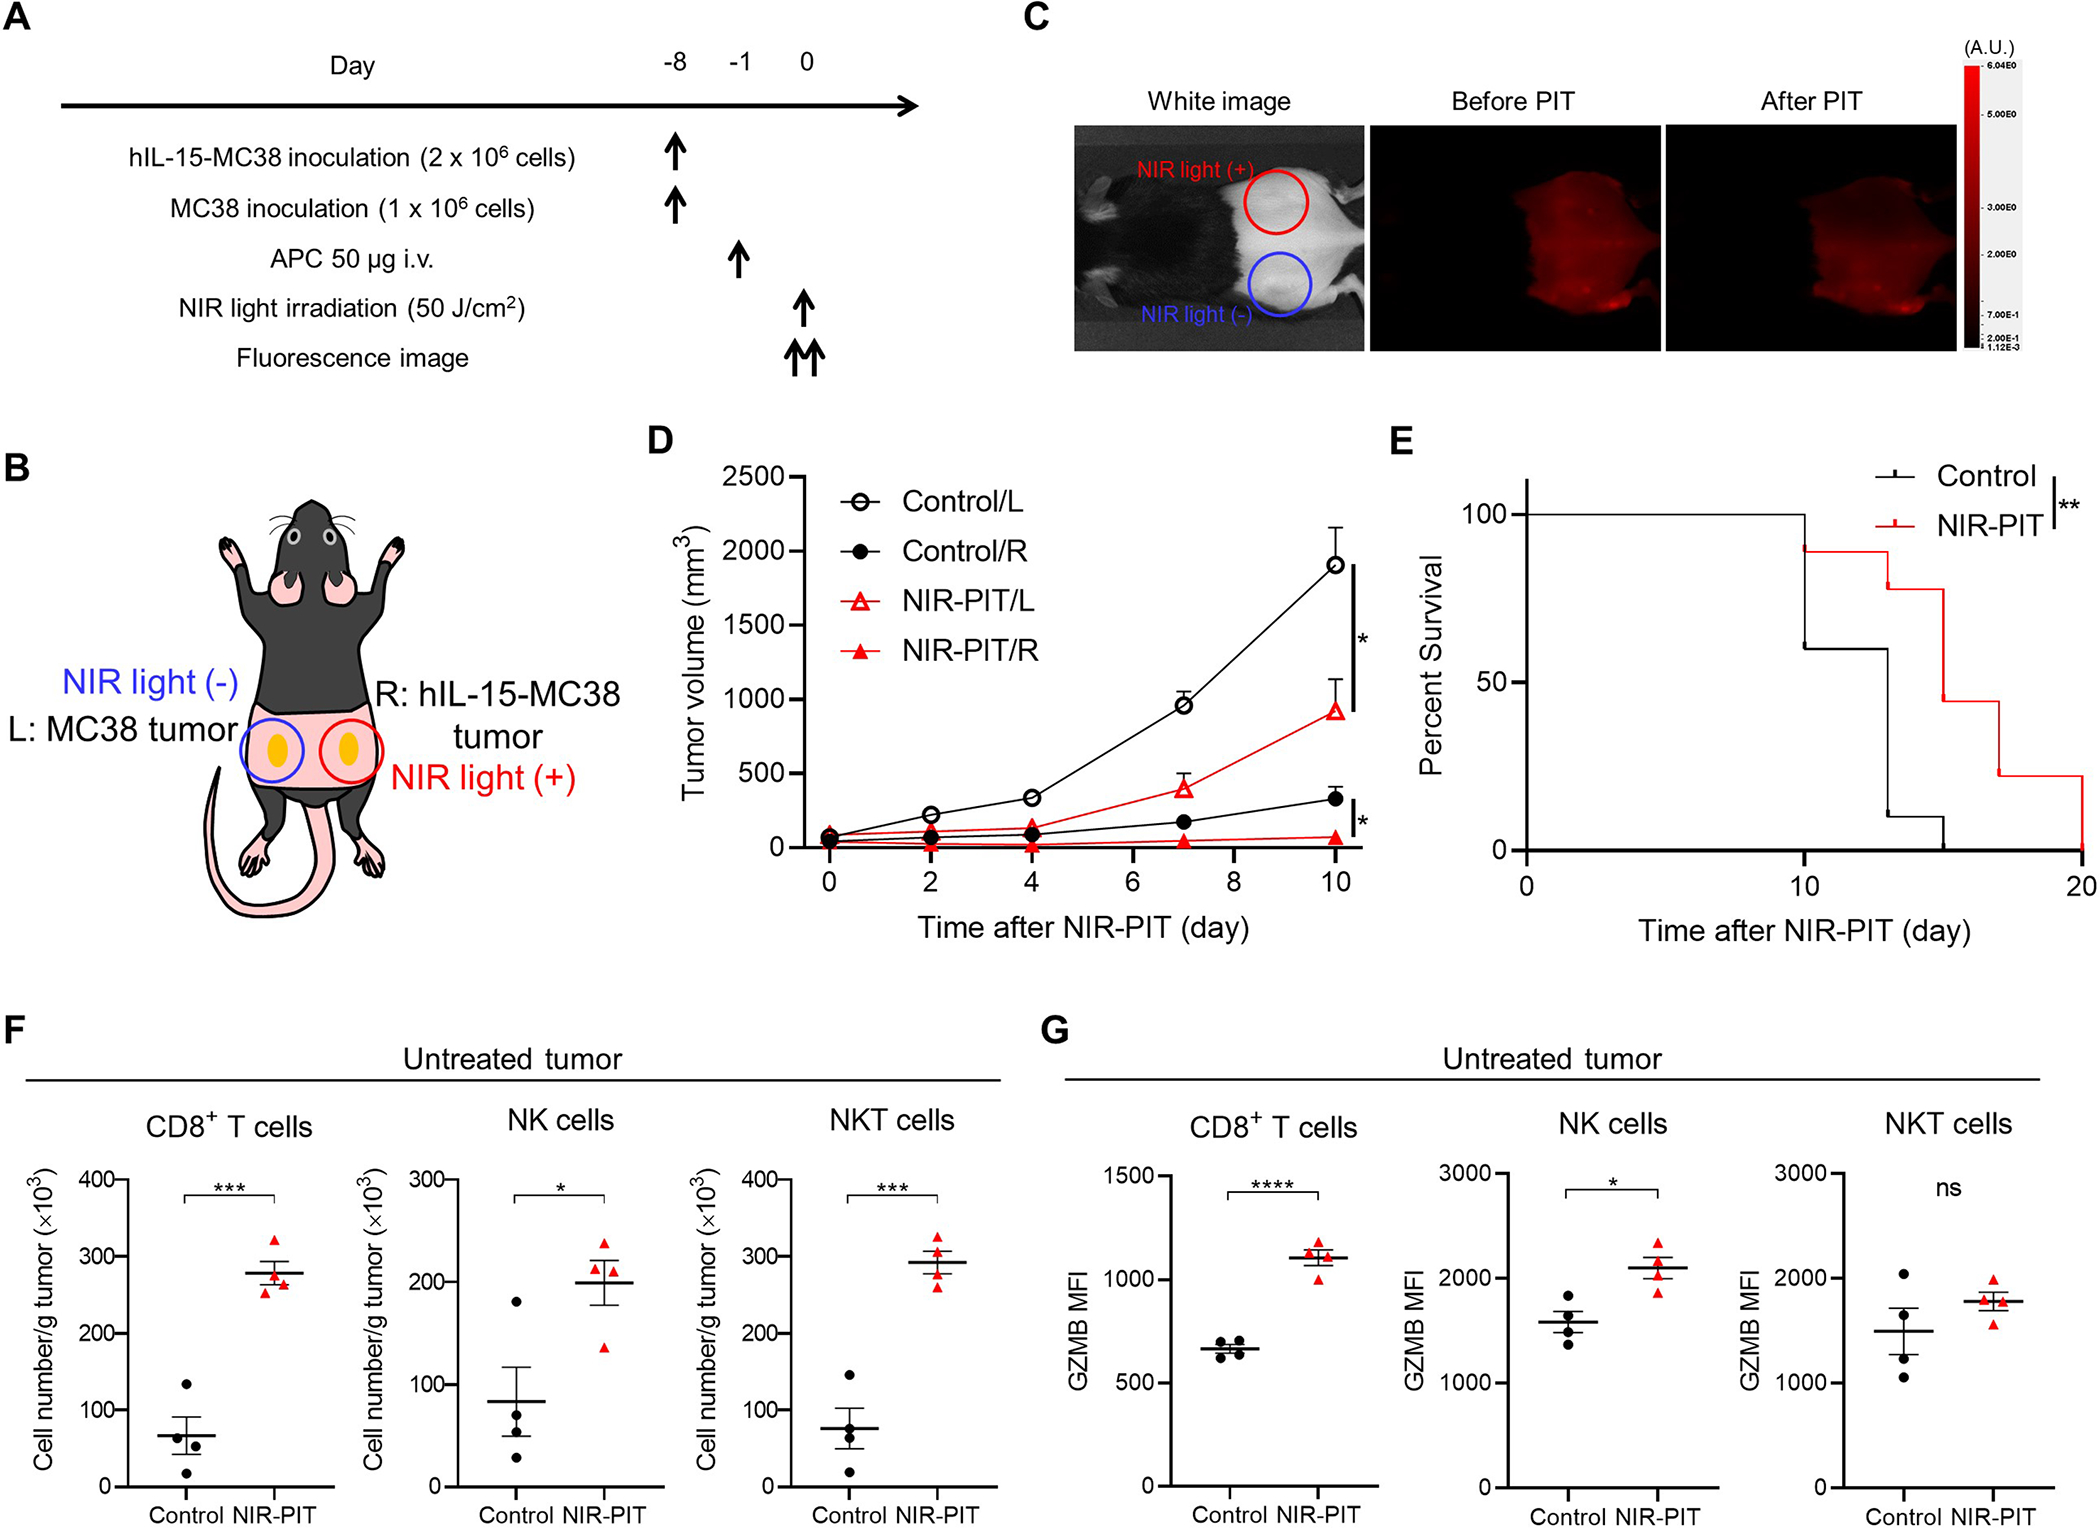
Figure 7.

In vivo therapeutic efficacy of CD44-targeted NIR-PIT in a bilateral tumor mouse model (R: hIL-15-MC38 tumor, L: MC38 tumor). NIR light was irradiated only to the right tumor. The left tumor was not exposed to NIR light. A, Treatment schedule. B, Diagram of NIR light irradiation. The red circle represents where NIR light was irradiated. C, Representative fluorescent imaging at 700 nm before and after NIR-PIT. A.U., arbitrary units. D, Tumor growth curves demonstrating partial abscopal effect in the untreated left tumor (n = 9–10; mean ± SEM; repeated measures two-way ANOVA followed by Tukey’s test); *, p < 0.05. E, Survival curves (n = 9–10, log–rank test); **, p < 0.01. F and G, Immune cell populations in untreated left tumors were evaluated by flow cytometry four days after CD44-targeted NIR-PIT demonstrating immune cell infiltration. The cell number/g tumor (F) and Granzyme B (GZMB) expression (G) for CD8+ T cells, NK cells, and NKT cells in untreated left tumors (n = 4; mean ± SEM; one-way ANOVA followed by Tukey’s test); *, p < 0.05; ***, p < 0.001; ****, p < 0.0001; ns, not significant.
