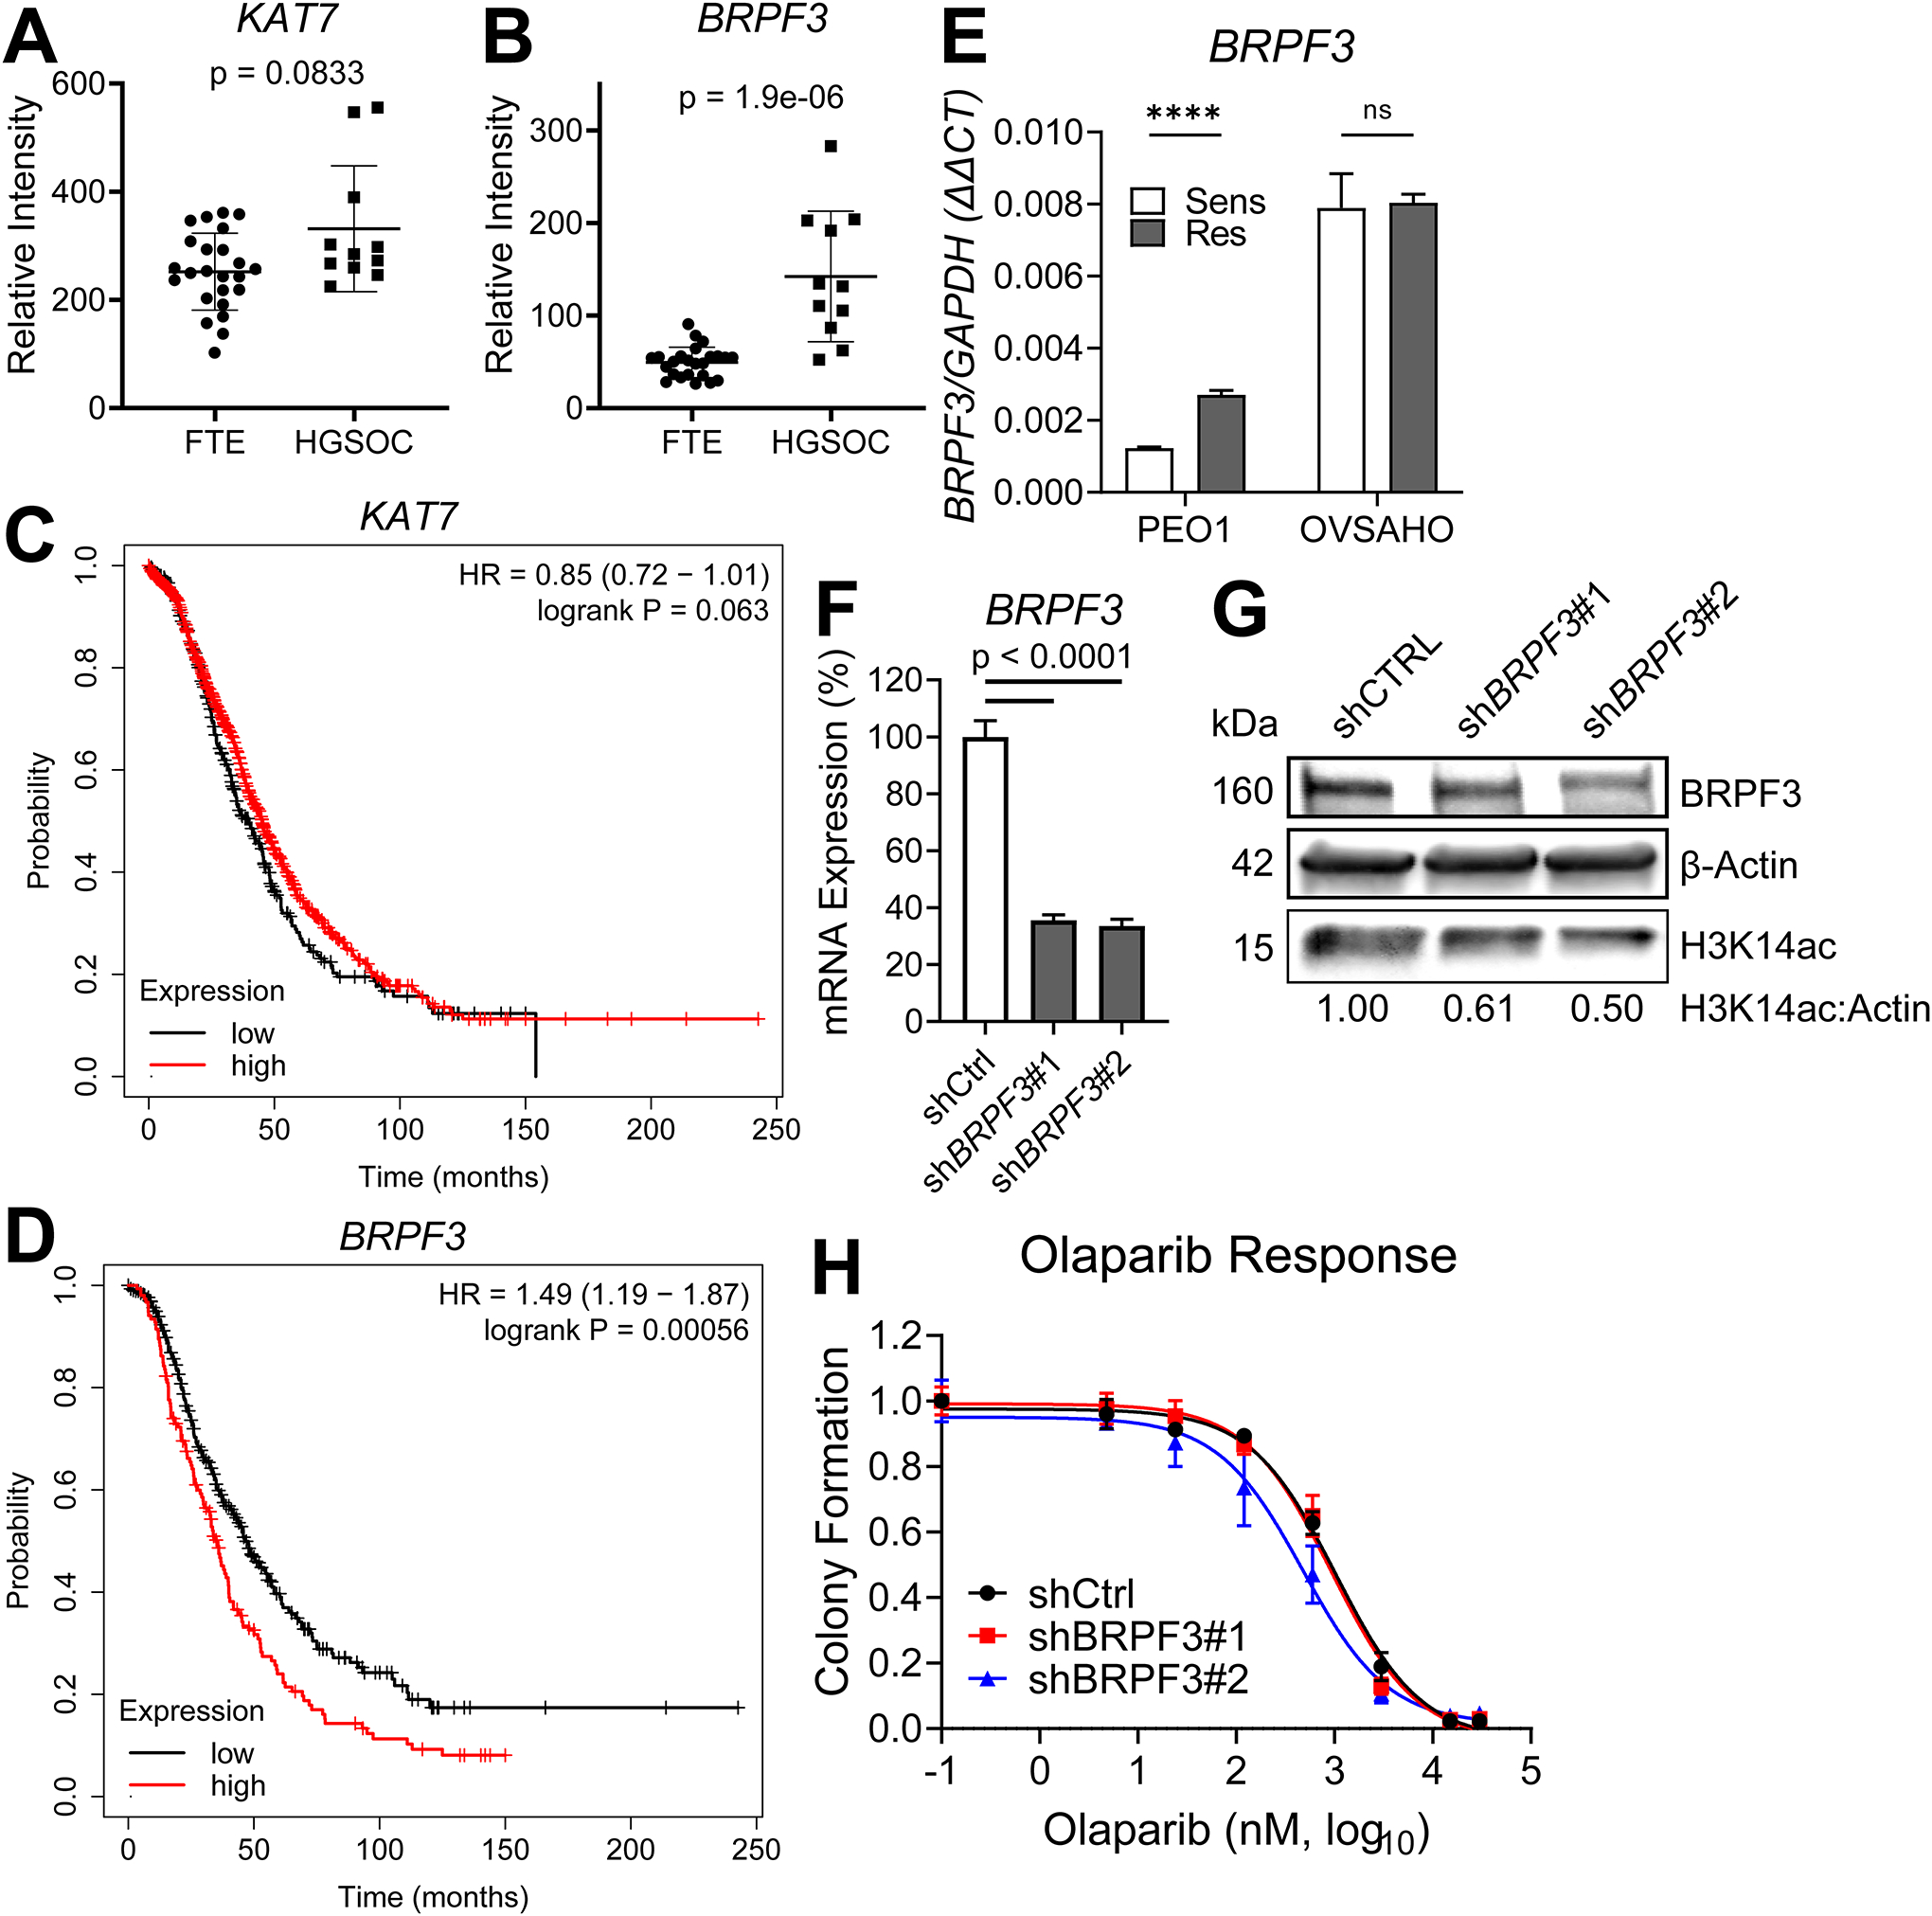
FIG 4. BRPF3 mRNA expression is elevated in HGSOC relative to normal fallopian tube, and elevated expression is associated with worse overall survival. BRPF3 knockdown moderately sensitizes PEO1-OR cells to olaparib.

(A-B) mRNA expression of KAT7 and BRPF3 in microarray dataset GSE10971 was compared between HGSOC and normal FTE. p-value by t-test. (C-D) TCGA microarray data for KAT7 and BRPF3 were analyzed using KMplot and Kaplan-Meier curves were generated for overall survival of high and low expressing patients for each gene. (E) mRNA from the indicated olaparib sensitive/resistant pairs was assayed for BRPF3 expression by RT-qPCR. Target gene expression was determined relative to GAPDH control by ΔΔCt method. Each bar represents the mean ± SD of three PCR reactions. p-values by t-test. **** p < 0.0001. PEO1-OR cells were then transduced with shRNA targeting BRPF3 or a non-targeting scrambled shRNA (shCTRL) and then selected in puromycin. Knockdown of BRPF3 was determined by RT-qPCR (F). Knockdown of BRPF3, as well as protein levels of H3K14ac and β-Actin loading control were assayed by immunoblot. (G). mRNA expression in (F) was determined relative to GAPDH by ΔΔCt method, then normalized to shCTRL for each knockdown. p-value by t-test. (H) Cells from F-G were treated with increasing doses of olaparib, and colony formation was assayed as described in Fig. 3B.
