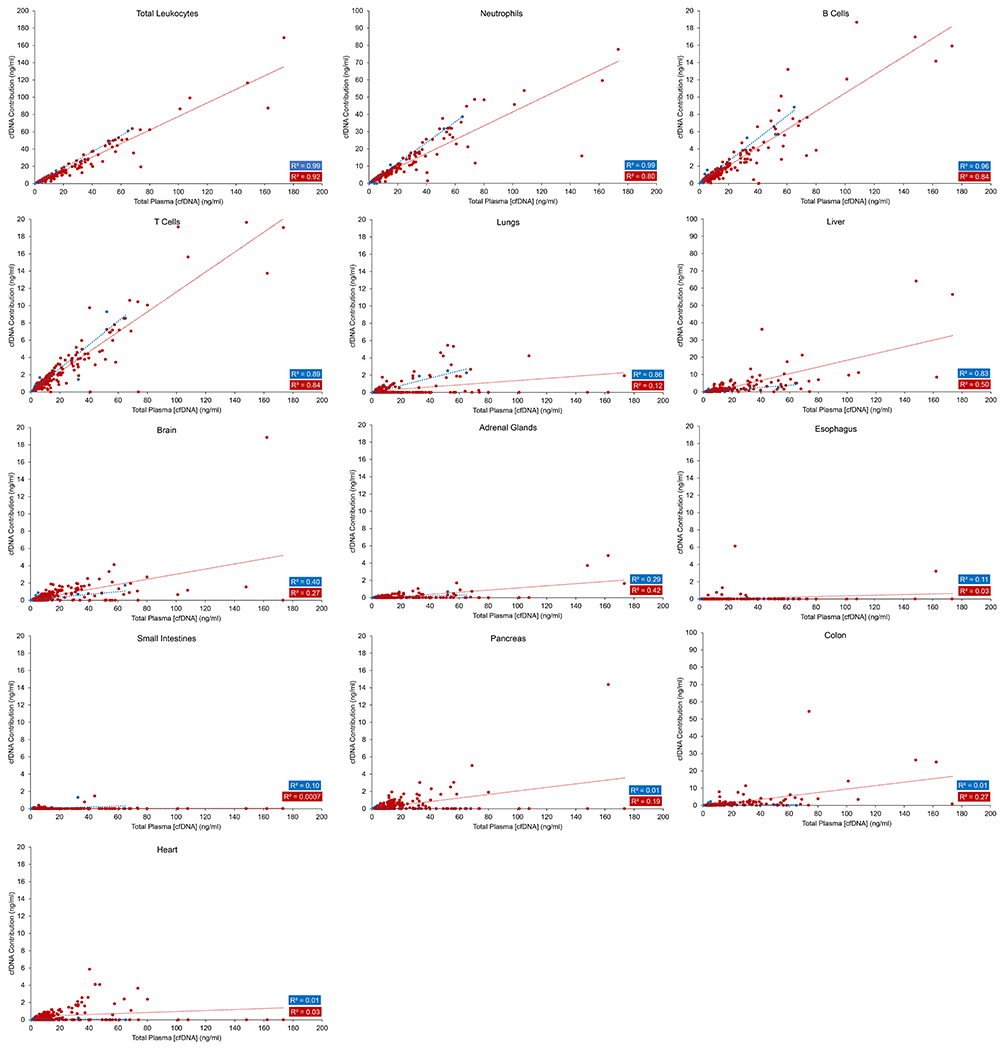
Figure 2. Deconvolution of the plasma cfDNA methylation profile using the reference cell type matrix derived from Sun et al. (3).

The total methylation profile of plasma cfDNA was deconvoluted into 12 different tissue types using quadratic programming. The total leukocyte concentration was taken to be the sum of the concentrations of neutrophils, B cells, and T cells. Note that the y-axes for the different tissue types shown are not the same.
