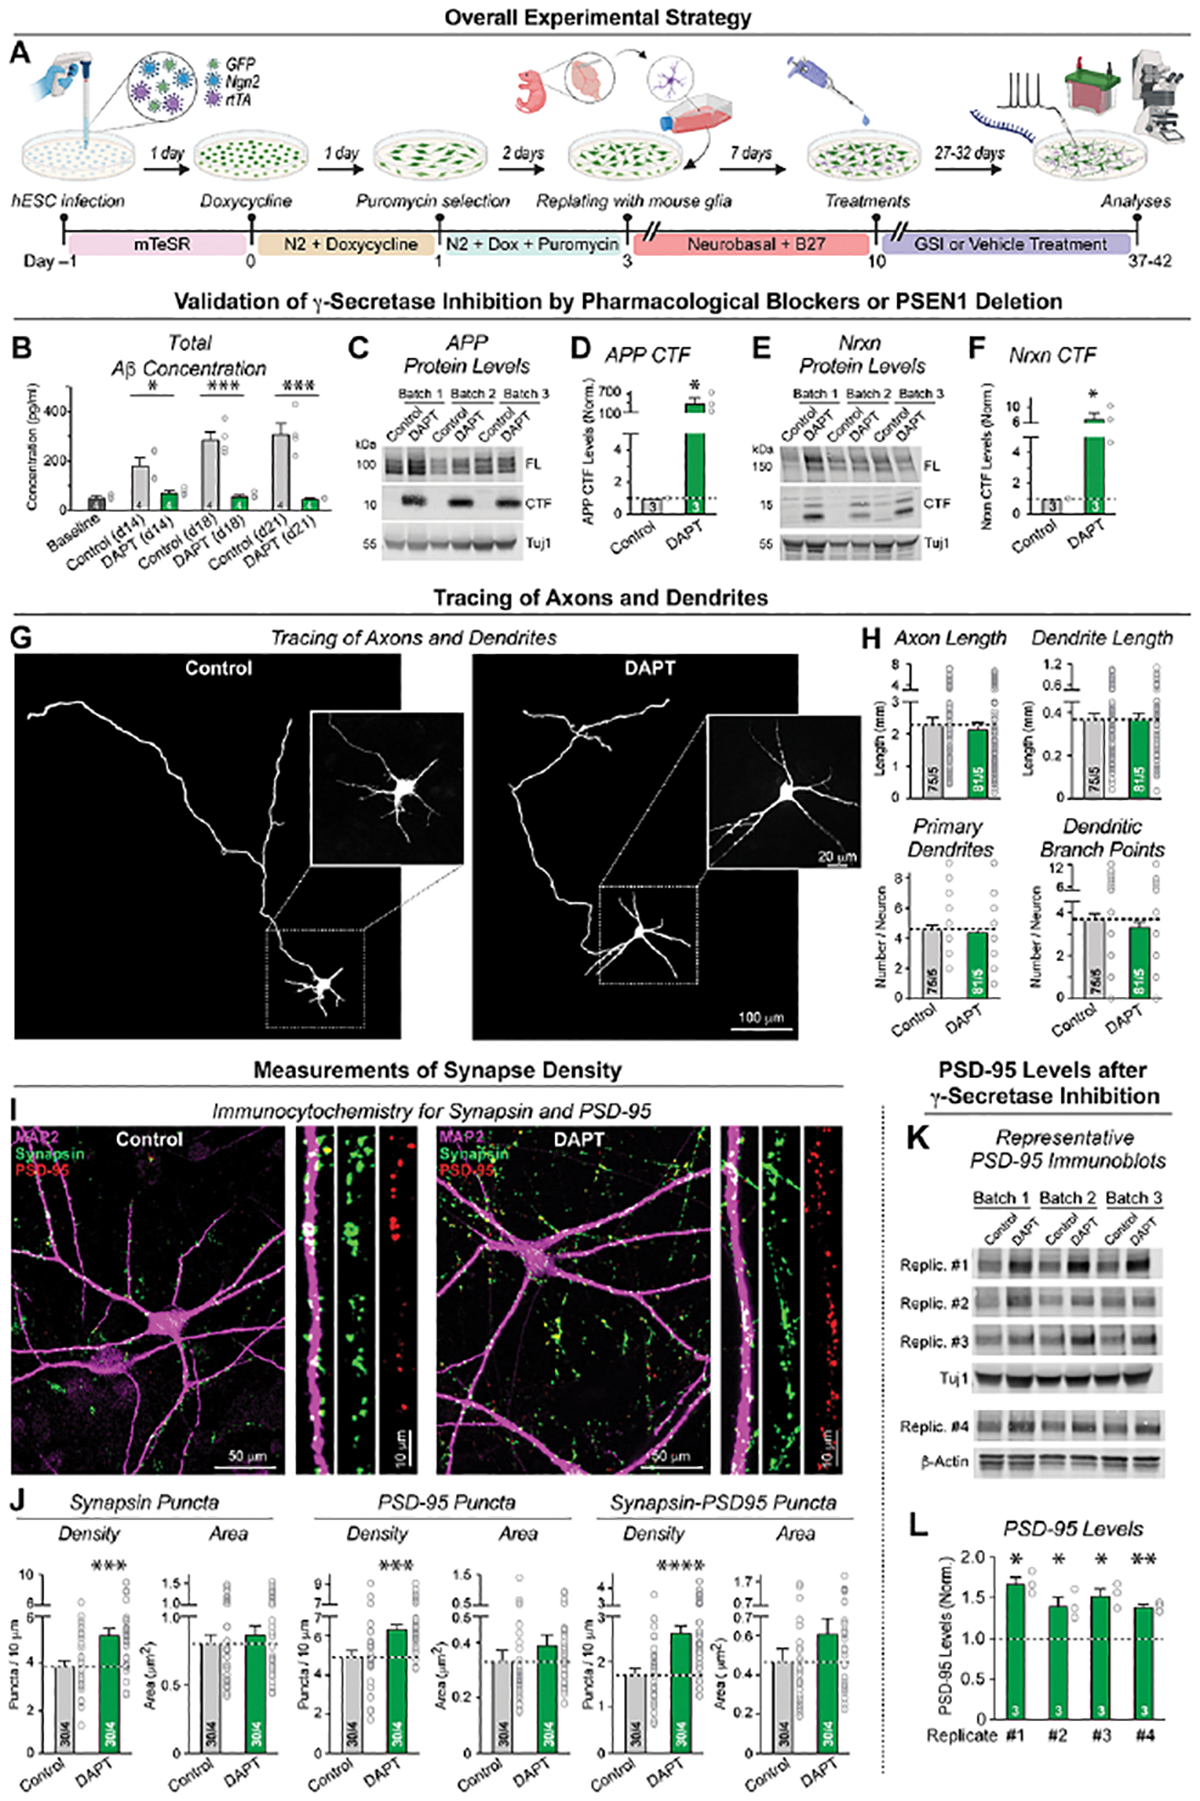
Figure 1: Chronic γ-secretase inhibition increases synapse numbers in human neurons (iN cells) without altering axonal or dendritic arborization.

(A) Experimental strategy. Human neurons were trans-differentiated from naïve or PSEN1-mutant H1-ES cells by forced expression of Ngn2 (Zhang et al., 2013). Neurons were treated with vehicle or one of two chemically different γ-secretase inhibitors (GSIs) starting at 10 days and analyzed by imaging, electrophysiology, biochemistry, or RNAseq at day 37–42.
(B) Chronic γ-secretase inhibition with DAPT (40 μM) reduces Aβ production in cultured human neurons as monitored by ELISA in the medium at day 8 (2 days prior to treatment), day 14, 18 and 21.
(C-F) Chronic γ-secretase inhibition increases the levels of the C-terminal fragments (CTFs) of APP (C & D) and of neurexins (E & F) in human neurons (C, E: representative immunoblot; D, F: summary graphs of CTF levels analyzed at day 37).
(G & H) Chronic γ-secretase inhibition has no effect on axonal or dendritic outgrowth (G, representative images; H, summary graphs of the axon length (top left), dendrite length (top right), number of primary dendrites (bottom left), and dendritic branch points (bottom right)). Neurons treated with vehicle or DAPT starting at day 10 were transfected with tdTomato at day 19 and analyzed on DIV21 to identify early developmental changes in dendritic and axonal architecture.
(I & J) Chronic γ-secretase inhibition robustly enhances synapses numbers (I, representative images of human neurons treated with DAPT or vehicle from day 10 to 37 and stained for presynaptic synapsin, postsynaptic PSD-95, and microtubule-associated protein MAP2 [right, zoomed-in dendrite segments]; J, summary graphs of the density and size of synaptic puncta adjacent to MAP2-positive dendrites stained for synapsin (left) or PSD-95 (middle), or double-labeled for synapsin and PSD-95 (right)). For replication experiments, see Figure S2.
(K & L) Chronic γ-secretase inhibition elevates PSD-95 protein levels (K, representative immunoblots; L, summary graphs of PSD-95 levels as determined in 4 independently replicated experiments). Immunoblots were quantified with fluorescently labeled secondary antibodies; signals were normalized for Tuj1 (Rep1 to 3) or β-actin (Rep 4) as loading controls. For replication experiments, see Figure S2.
Data in (B), (D), (F), (H), (J), (L) are means +/− SEM (numbers in bars show cells/independent biological replicates (H, J), or biological replicates (B, D, F, L). Statistical analyses were performed with two-tailed unpaired t-tests, with * = p<0.05; ** = p<0.01, *** = p<0.001. For additional data, see Figures S1 and S2.
