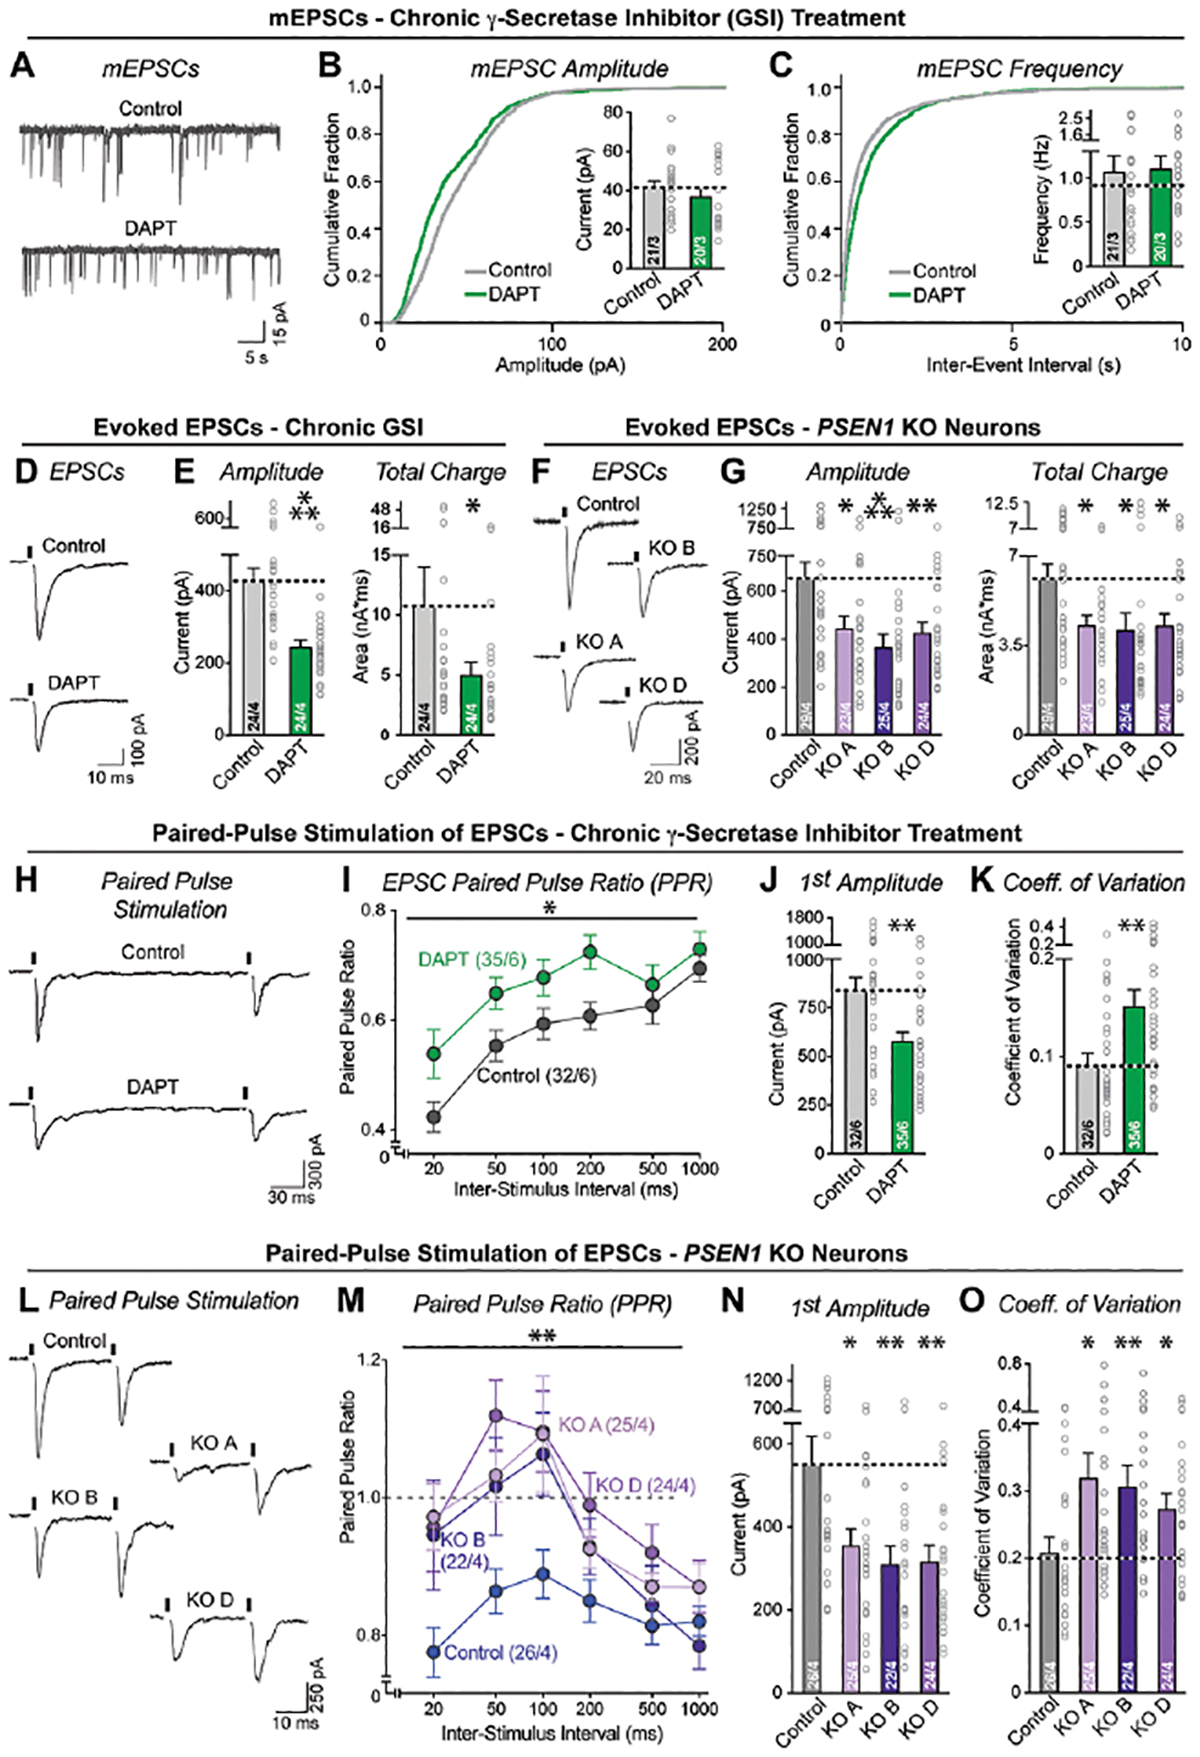
Figure 2: γ-Secretase activity is required for normal neurotransmitter release.

(A–C) Chronic suppression of γ-secretase activity produces no major impairments in mEPSCs (A, representative mESPC traces recorded on day 37–42 from human neurons treated chronically with vehicle (0.5%) or DAPT (40 μM); B & C, cumulative probability plots of the interevent intervals (B) and amplitudes (C) of mESPCs [insets: mean mEPSC frequency (B) and amplitude (C)]).
(D & E) Chronic suppression of γ-secretase activity impairs evoked synaptic transmission (D, representative traces; E, summary graphs of the EPSC amplitude (left) and charge transfer (right)).
(F & G) Same as D and E but measured in PSEN1 KO vs. control neurons.
(H & I) Chronic suppression of γ-secretase activity lowers paired-pulse depression, suggesting a decline in release probability (H, representative traces of EPSCs evoked by two closely spaced stimuli [stimulus intervals (20–1000 ms) are indicated above traces; for full traces, see Figure S3]; I, summary plot of the paired-pulse ratios as a function of the interstimulus interval).
(J) Confirmation that chronic suppression of γ-secretase activity lowers synaptic strength as monitored via the amplitude of first evoked EPSCs during paired-pulse stimulation (summary graph of EPSC amplitude).
(K) Chronic suppression of γ-secretase activity increases the coefficient of variation of evoked EPSC amplitudes, consistent with a reduced release probability.
(L–O) PSEN1 mutant vs. control neurons show increased coefficients of variation of evoked EPSC amplitudes, demonstrating that genetic suppression of γ-secretase activity also dramatically decreases the release probability of human neurons. Full traces are shown in Figure S3.
Numerical data are means ± SEM (numbers of cells/experiments are listed in bars). Statistical analyses were performed by two-tailed unpaired t-test (DAPT data) or two-way ANOVA with Bonferroni’s multiple comparison (PSEN1 KO data), with * = p<0.05; ** = p<0.01, *** = p<0.001. For intrinsic properties and controls, see Figure S3 and S4.
