
Figure 4: Chronic suppression of γ-secretase activity upregulates cholesterol synthesis gene expression in human neurons but not in mouse glia.
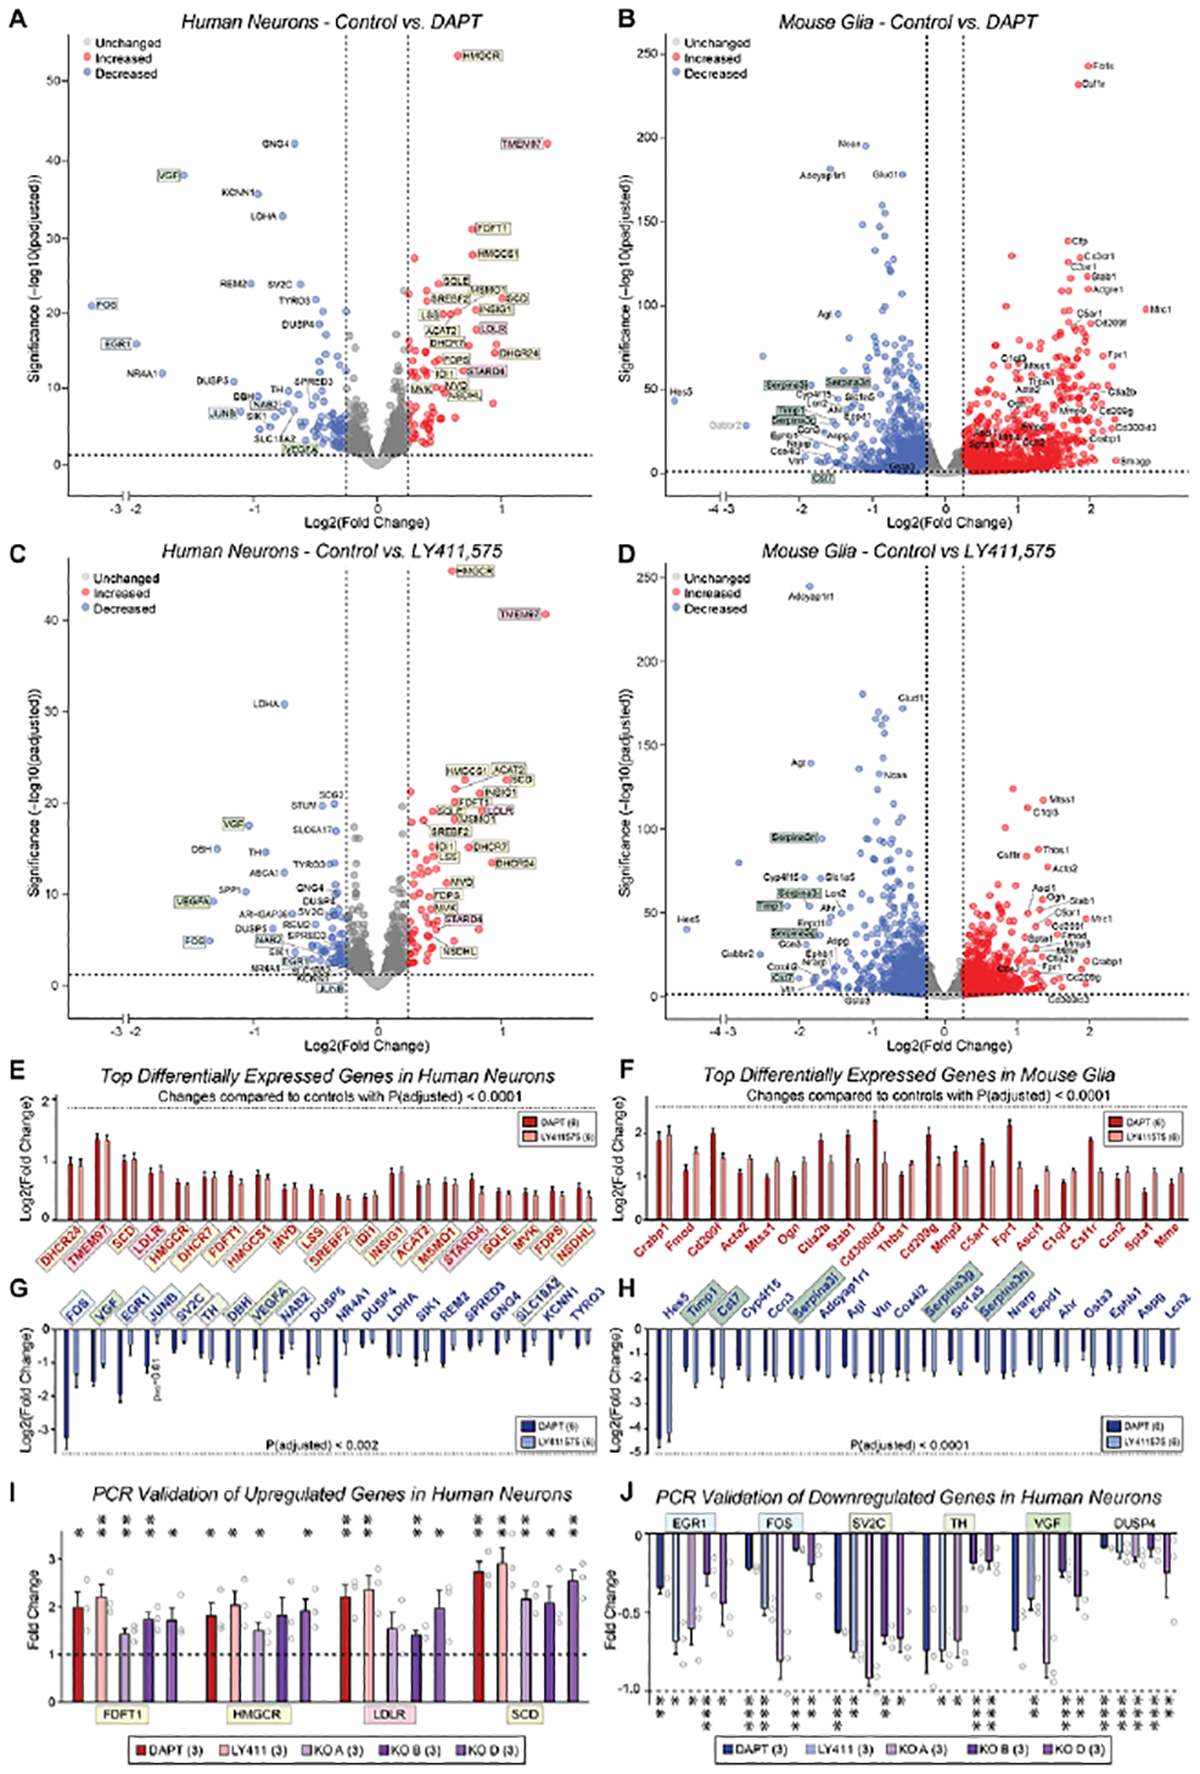
(A & B) Volcano plots of differentially expressed genes (DEGs) from co-cultured human neurons (A) and mouse glia (B) that were chronically treated with the γ-secretase inhibitor DAPT (40 μM) or vehicle (DMSO only) from day 10–40, and analyzed by bulk RNAseq. Data resulted from pairwise comparisons of each treatment group versus vehicle, normalized to raw counts, with a standard False Discovery Rate of 0.1; data underwent the Benjamini-Hochberg correction to obtain adjusted p-values (yellow, cholesterol synthesis genes; pink, cholesterol transport genes; blue, activity-dependent immediate early genes; light green, growth factors; dark green, protease inhibitors).
(C & D) Same as A and B, except that the cells were treated with the γ-secretase inhibitor LY411,575 (2.5 μM).
(E & F) Bar graphs for the top 20 upregulated genes identified by RNAseq analyses of DAPT-and LY411575-treated human neurons (E) and mouse glia (F) that exhibited adjusted p-values of <0.0001. The cutoff for log2(fold change) values (y-axis) was >0.3, corresponding to a fold change greater than 20% relative to controls.
(G & H) Same as E & F, but for the top 20 downregulated genes, using adjusted p-values of <0.002 (G) or <0.0001 (H).
(I) qRT-PCR measurement of 4 upregulated cholesterol synthesis pathway genes in three lines of PSEN1 KO human neurons, DAPT- and LY411,575-treated human neurons.
(J) qRT-PCR measurement of 4 upregulated cholesterol synthesis pathway genes in three lines of PSEN1 KO human neurons, DAPT- and LY411,575-treated human neurons.
(K) qRT-PCR measurement of 6 downregulated genes in three lines of PSEN1 KO human neurons in DAPT- and LY411,575-treated human neurons.
Data in (E-J) are means +/− SEM: (A-H) have 6 biological replicates; (I and J) have 3 biological replicates. Statistical analyses for were performed using the Wald test (A-H) and two-tailed unpaired t-test (I-J) and plotted as fold change relative to controls (*p<0.05; **p<0.01, ***p<0.001). For additional validation data, see Figure S6.