
Fig. 1: Galectin-1 (Gal1) promotes tumor induced-MDSC both in local and systemic compartments.
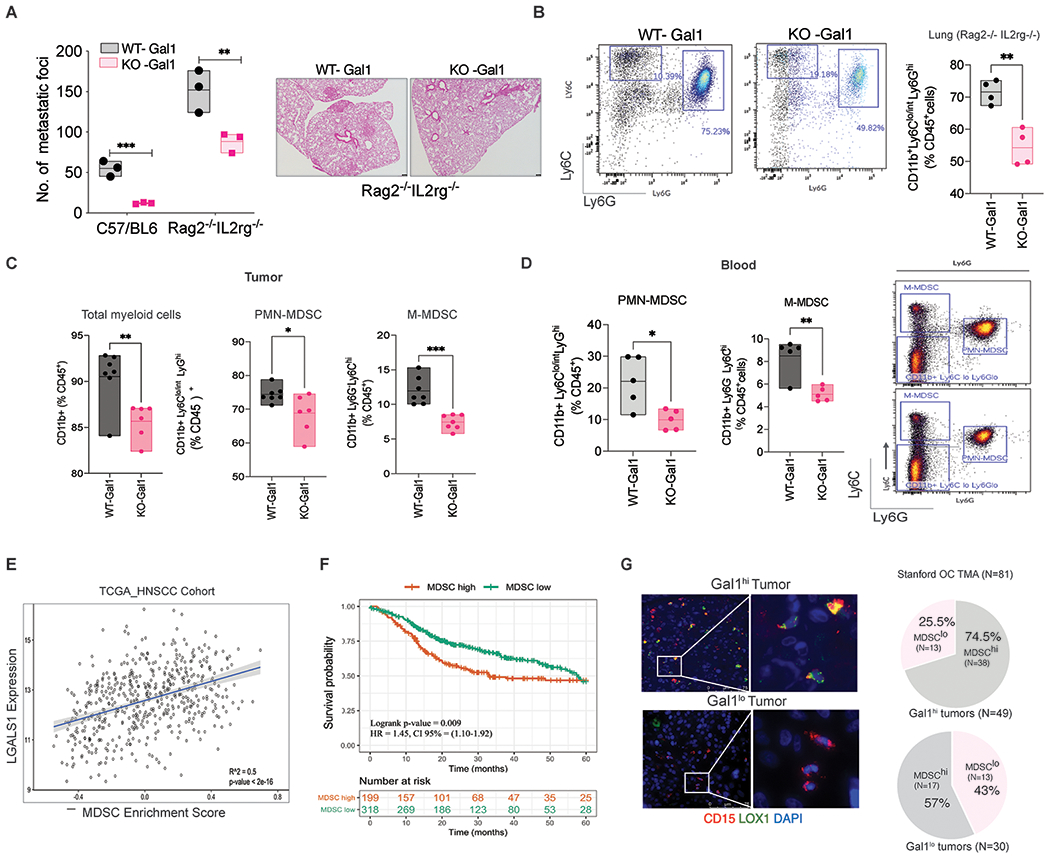
A. Quantification of lung metastases foci after subcutaneous. implantation of MOC2 WT-Gal1 or KO-Gal1 cell lines in immune-competent C57/BL6 or immune deficient (Rag2−/− IL2rg−/−) mice. The number of nodules per lung area was quantified by H&E staining (Right). B. Quantification of CD11b+Ly6Clo/int Ly6G+ cells in lungs of mice implanted with MOC2 WT-Gal1 and KO-Gal1 tumors in Rag2−/− IL2rg−/−, after enzymatic dissociation and flow cytometry analyses. C. Quantification of total myeloid cells (CD11b+), PMN-MDSC (CD11b+Ly6Clo/intLy6G+) and M-MDSC (CD11b+Ly6G− Ly6Chi) cells in MOC2 WT-Gal1 and KO-Gal1 tumors after enzymatic dissociation and flow cytometry analyses. D. Quantification of PMN-MDSC (CD11b+Ly6Clo/intLy6G+) and M-MDSC (CD11b+Ly6G−Ly6Chi) cells in the blood at Day 14 in mouse bearing subcutaneous MOC2 WT/ KO-Gal1 tumors. E. Pearson’s correlation was used to assess the correlation between LGALS1 gene expression and MDSC enrichment scores in the TCGA HNSCC cohort. F. Kaplan Meir survival analyses for the TCGA HNSCC cohort using Gene Set variation analyses depict survival differences between patients with MDSChi and MDSClo (based on the enrichment score). The enrichment score for each patient sample was the difference in the statistic between genes inside and outside of the MDSC signature gene set. For the MDSC enrichment score survival analysis, risk groups were defined by using the MDSC enrichment score of 0.1. G. Immunofluorescence staining of PMN-MDSC in human oral cavity cancer TMA (N=81) using CD15 (red), LOX1 (green), and DAPI (Blue) staining. The white insets represent zoomed area (right image). The Pie chart (right panel) represents the distribution of patients with high or low MDSC burden in the cohort of patients with high Gal1 (N=51) and low Gal1 (N=30) expressing tumors.