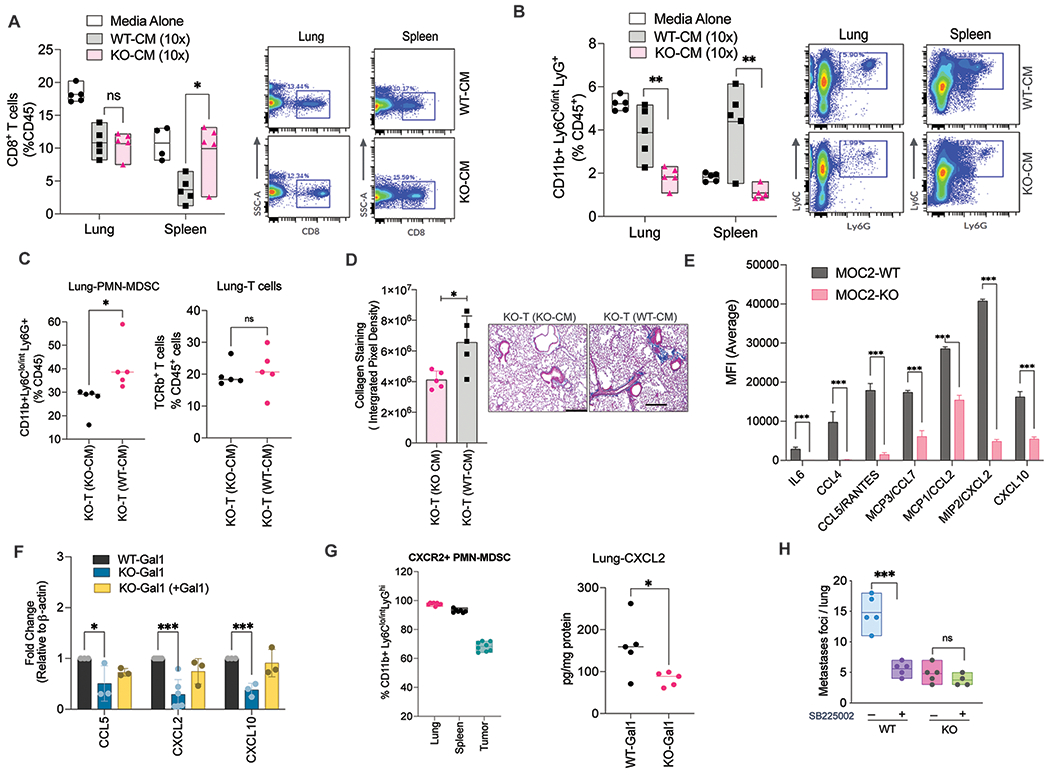
Fig. 4: Galectin-1 enhances MDSC recruitment to pre-metastatic site by increasing myeloid chemokine production.

A. Quantification and flow plots showing the percentage of CD8+T cells in the lungs and the spleen of tumor naïve mice after ~3 weeks of treatment with either WT- or KO-Gal1 conditioned media (CM) or control media. B. Quantification and flow plots showing the percentage of PMN-MDSCs in the lung or spleen of tumor naïve mice after ~3 weeks of treatment with either WT- or KO-Gal1 CM or control media. C. Quantitation of PMN-MDSCs and T cells in the lungs of mice bearing KO-Gal1 tumors injected with either WT- or KO-Gal1 CM for 3 weeks. D. Quantitation and representative images showing the amount of collagen staining (Trichrome staining) in the lungs of mice bearing KO-Gal1 tumors injected with either WT- or KO-Gal1 CM for 3 weeks. E. Luminex data showing differentially secreted cytokines between the WT/KO-Gal1 conditioned media from MOC2 cells collected after 24h of culture followed by 10x concentration. F. Relative mRNA expression of CCL5, CXCL2 and CXCL10 in MOC2 WT-Gal1 cells, KO-Gal1, or KO-Gal1 with exogenously reconstituted Gal1. G. (Right panel) Quantification of CXCR2 expression on the PMN-MDSCs isolated from the lung, spleen, and the tumor of MOC2 WT-Gal1 tumor-bearing mice; (Left panel) Quantification of CXCL2 protein levels in the lung lysate from mice bearing MOC2 WT- or KO-Gal1 tumors. H. Quantification of metastatic foci per lung from MOC2 WT/KO-Gal1 tumors treated with vehicle or SB225002 (CXCR2 inhibitor). Two-tailed unpaired t-test was performed for the comparisons between the two groups. Two-way ANOVA and Tukey’s multiple comparisons test were performed when more than two groups were compared. Each dot represents one mouse. Data are shown as mean+/−SD. All experiments were repeated 2 times with similar results.
